xStack DGS-3400 Series Layer 2 Gigabit Ethernet Managed Switch
CPU Utilization
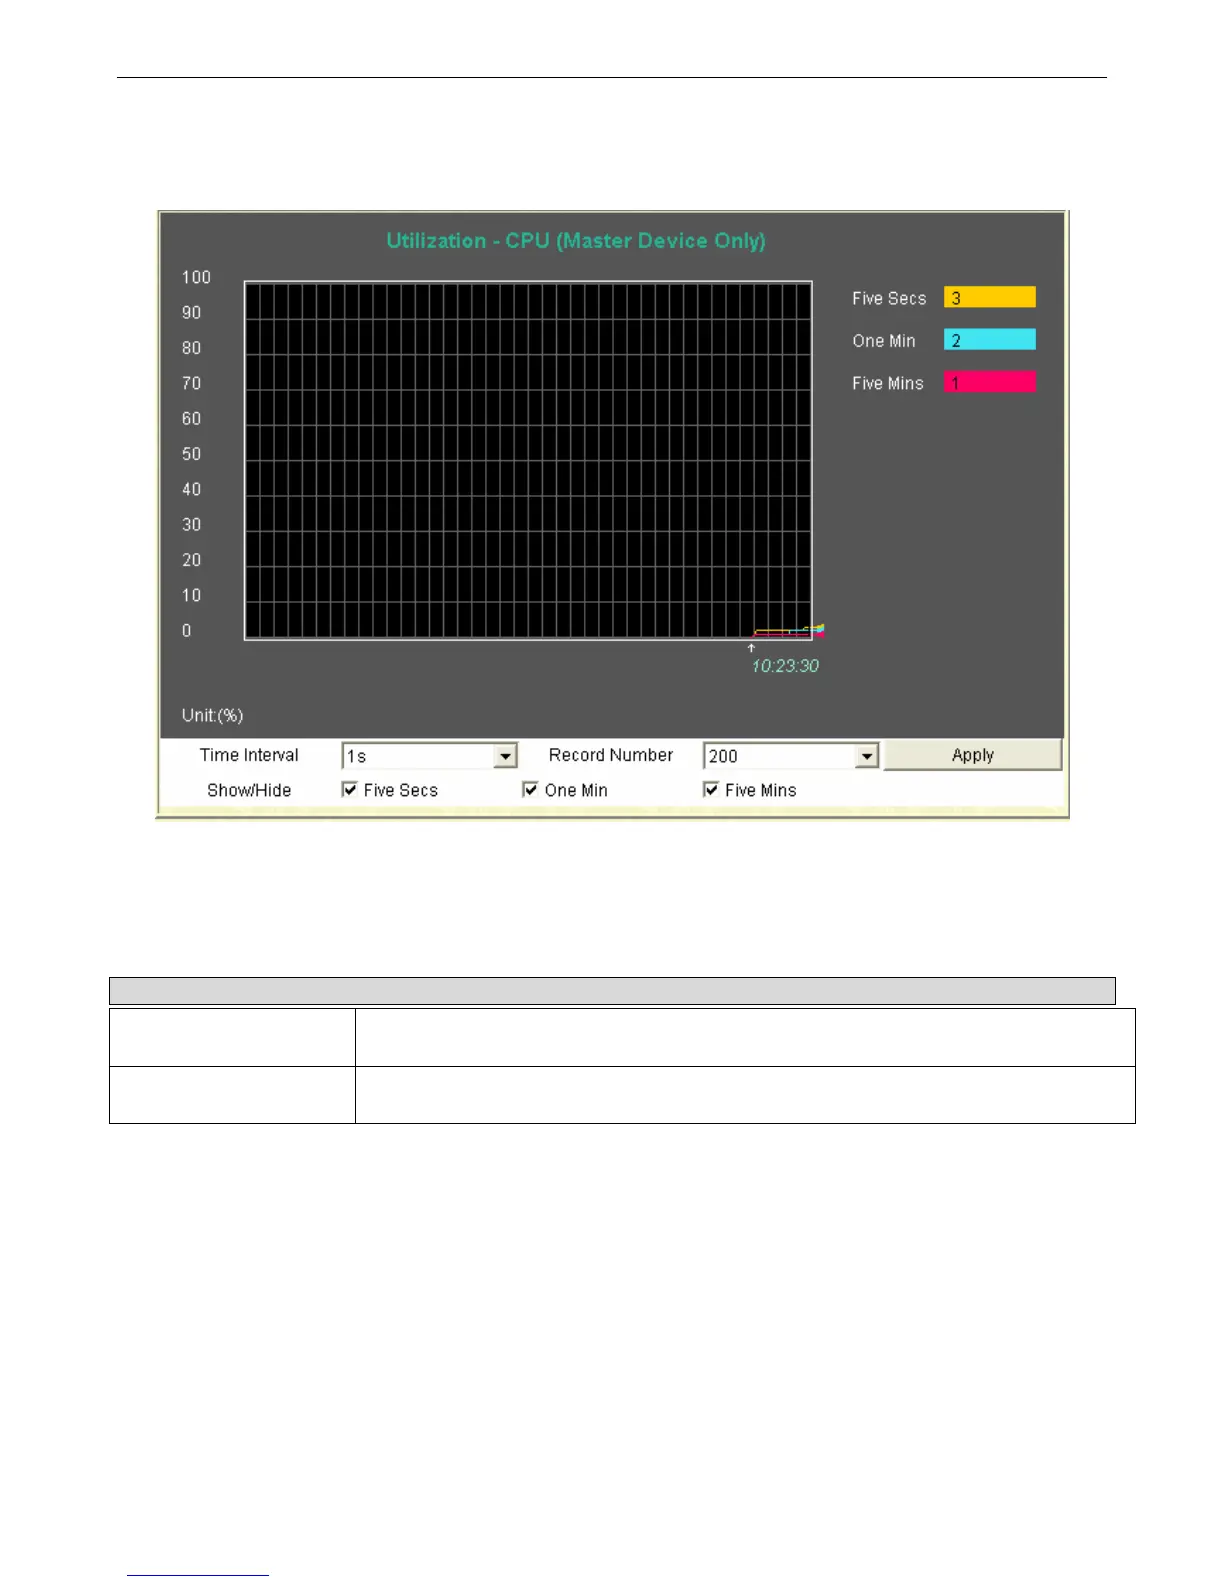
The CPU Utilization displays the percentage of the CPU being used, expressed as an integer percentage and calculated as a
simple average by time interval. To view this window, click Monitoring > CPU Utilization link.
Figure 11- 4. CPU Utilization graph
To view the CPU utilization by port, use the real-time graphic of the Switch and/or switch stack at the top of the web page by
simply clicking on a port. Click Apply to implement the configured settings. The window will automatically refresh with new
updated statistics.
Change the view parameters as follows:
Parameter Description
Time Interval [1s ]
Select the desired setting between 1s and 60s, where "s" stands for seconds. The default
value is one second.
Record Number [200]
Select number of times the Switch will be polled between 20 and 200. The default value is
200.
250