SS2100i-1 Gas Analyzer
1–6 4900002224 rev. E 12-18-20
laser is tuned on-resonance versus off-resonance is directly proportional to the
number of molecules of that particular species in the beam path, or
.(1)
Figure 1–2 on page 1–7 shows the typical raw data from a laser absorption
spectrometer scan including the incident laser intensity, I
0
(), and the
transmitted intensity, I(), for a clean system and one with contaminated
mirrors (shown to illustrate the system’s relative intensity to mirror
contamination). The positive slope of raw data results from ramping the current
to tune the laser, which not only increases the wavelength with current, but
also causes the corresponding output power to increase. By normalizing the
signal by the incident intensity, any laser output fluctuations are canceled, and
a typical, yet more pronounced, absorption profile results. Refer to Figure 1–3
on page 1–7.
Note that contamination of the mirrors results solely in lower overall signal.
However, by tuning the laser off-resonance as well as on-resonance and
normalizing the data, the technique self calibrates every scan resulting in
measurements that are unaffected by mirror contamination.
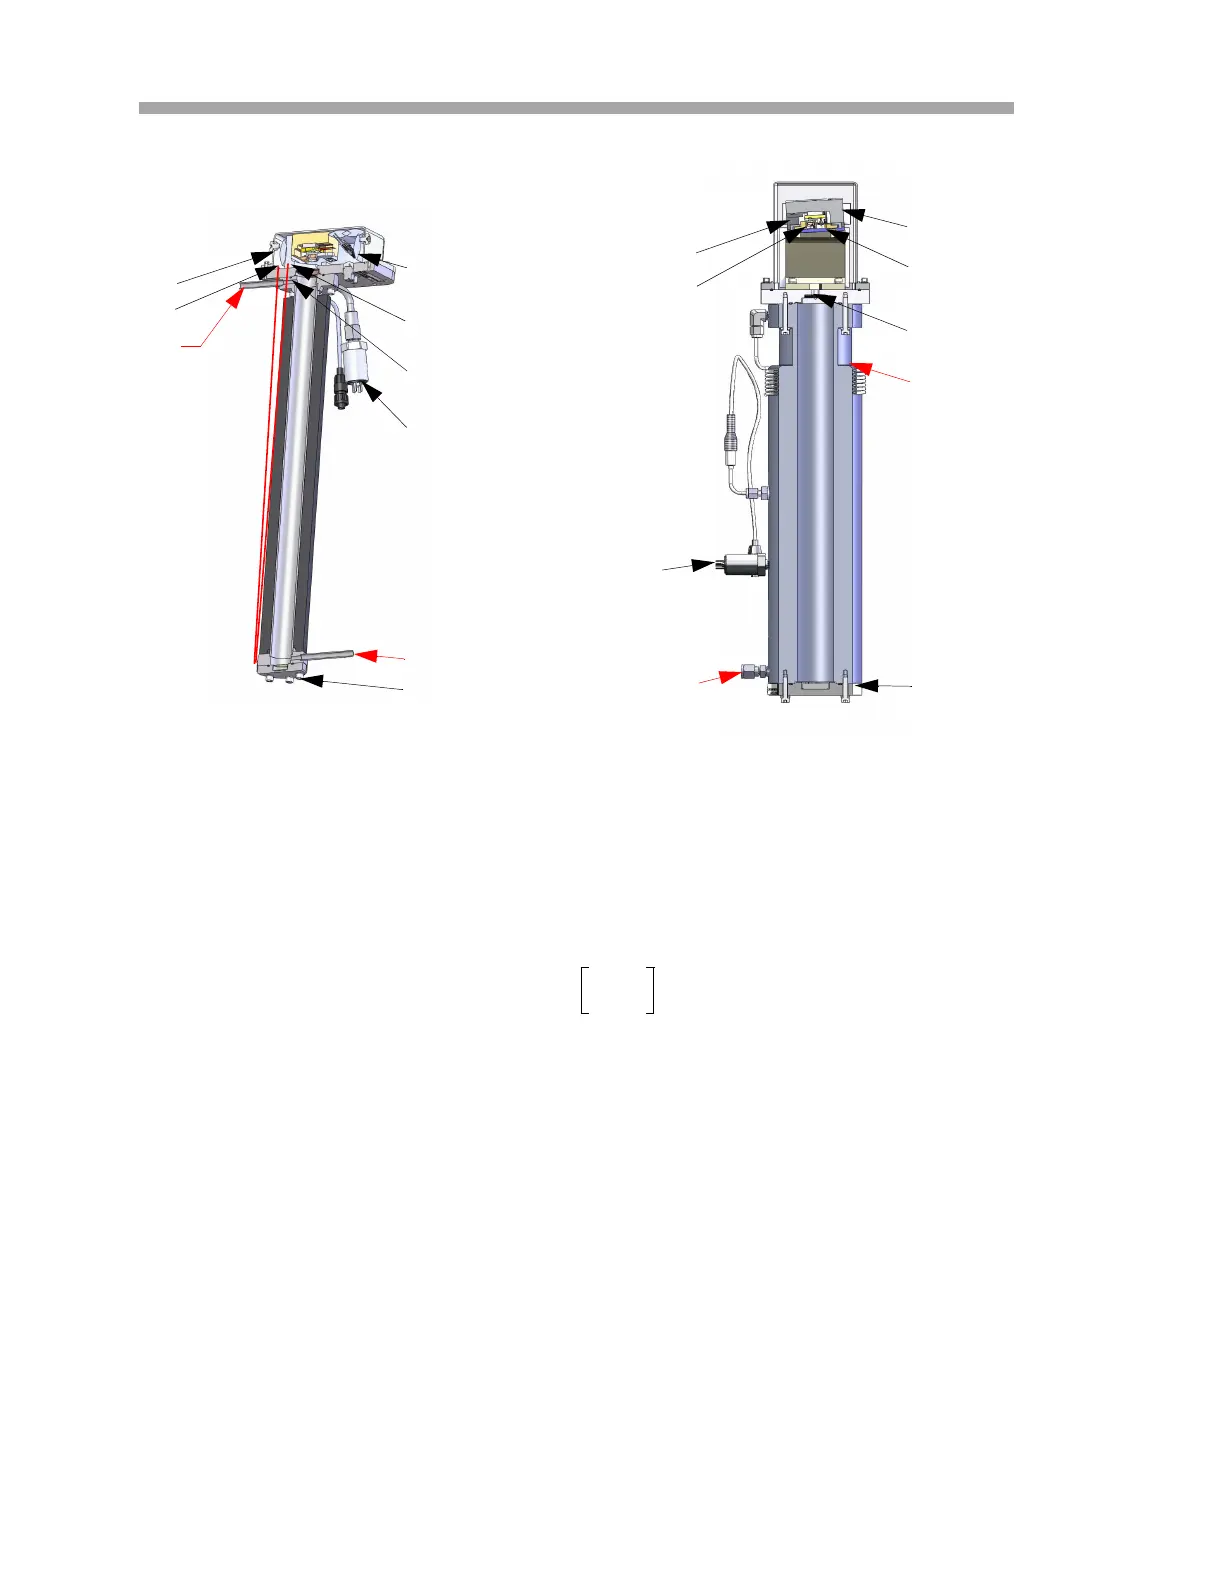
OPTICAL HEAD
DETECTOR
WINDOW
INLET
FAR MIRROR
TEC
LASER
OUTLET
PRESSURE SENSOR
0.8 m MEASUREMENT CELL
OPTICAL HEAD
DETECTOR
WINDOW
OUTLET
FAR MIRROR
TEC
LASER
INLET
PRESSURE SENSOR
Figure 1–1 Schematic of a typical tunable diode laser
absorption spectrometer
8/28 m MEASUREMENT CELL
N
1–
l
--------------
I
I
0
-------------
ln=

 Loading...