Vital Signs Simulator
ECG Function
25
To change the width of the R Wave:
1. Push or to highlight the Width value.
2. Push .
3. Push or to adjust the width. Each push of a key increases or decreases
the width 20 ms for each key push when the value is 20 ms or above and
2 ms when the value is 20 ms or less. The Product simulates an R Wave
width of 8 ms to 200 ms.
4. When the amplitude is set, push to enter the value and go back to the
R Wave Detection screen.
Set QRS Detection Test Values
The QRS Detection wave group supplies a signal that you can adjust the width of
the QT interval. This QRS Detection wave includes the R and S waves with
relative amplitudes as specified in EC-13. The R wave is 0.875 of the waveform
amplitude and the S wave is negative at 0.125 of the waveform amplitude. The R
wave up slope is 0.4375 of the waveform width. The R wave down slope is 0.5 of
the waveform width. The S wave up slope is 0.0625 of the waveform width.
To generate a signal for an QRS detection test:
1. Push to show the ECG screen on the display.
2. Push or to highlight the Wave Group value.
3. Push .
4. Push or to highlight the QRS Detection value in the wave group list.
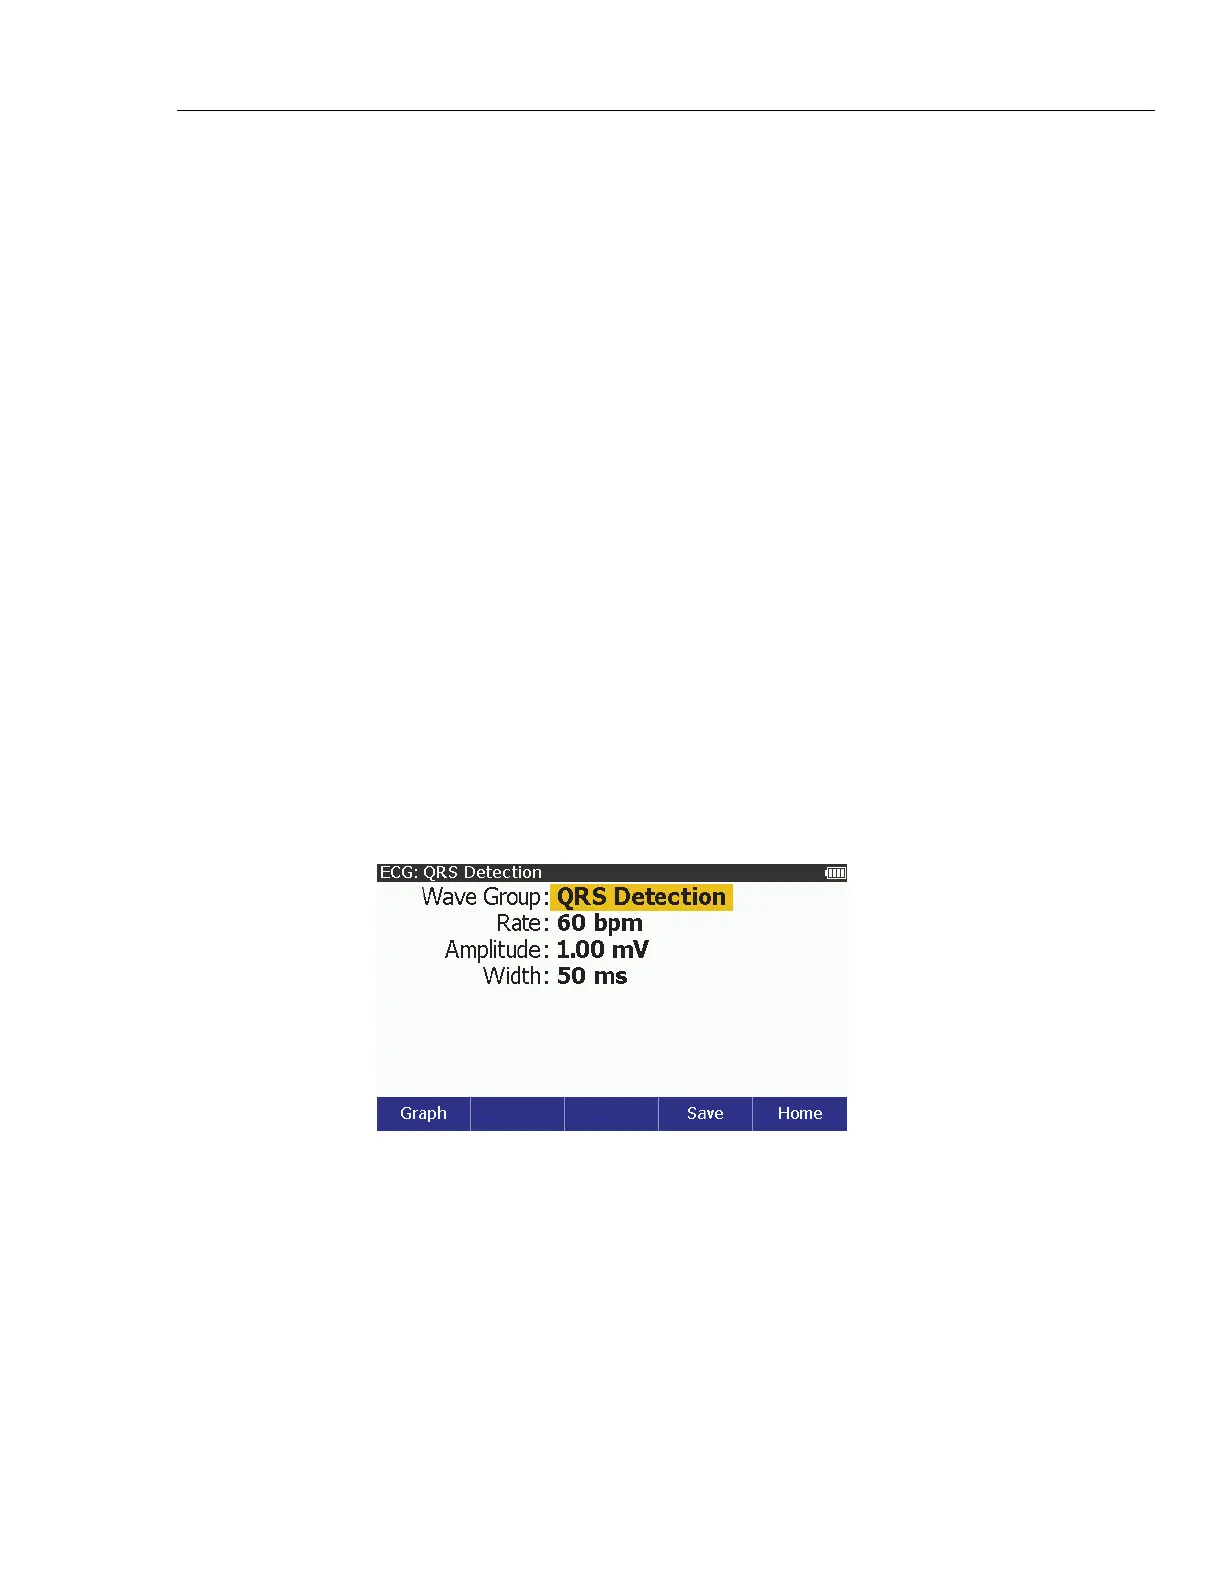
5. Push to show the ECG: QRS Detection screen in Figure 10 on the
display.
glh021.bmp
Figure 10. QRS Detection Screen
You can change the rate, amplitude, and width of the QRS wave.
To change the rate:
1. Push or to highlight the Rate value.
2. Push .
3. Push or to highlight 30, 60, 90, 120, 200, or 250 bpm in the list.
4. Push to set the rate and go back to the ECG: QRS Detection screen.