ProSim 8
Users Manual
24
Set R Wave Detection Values
To sense a heartbeat, a monitor looks for R waves. The sensed R wave is used
to calculate heart rate and other analysis. You adjust the R wave to find the
range of values a heart monitor can sense a heartbeat. The R wave is a simple
triangular pulse.
To output a signal for an R Wave detection test:
1. Push to show the ECG screen on the display.
2. Push or to highlight the Wave Group value.
3. Push .
4. Push or to highlight the R Wave Detection value in the wave group list.
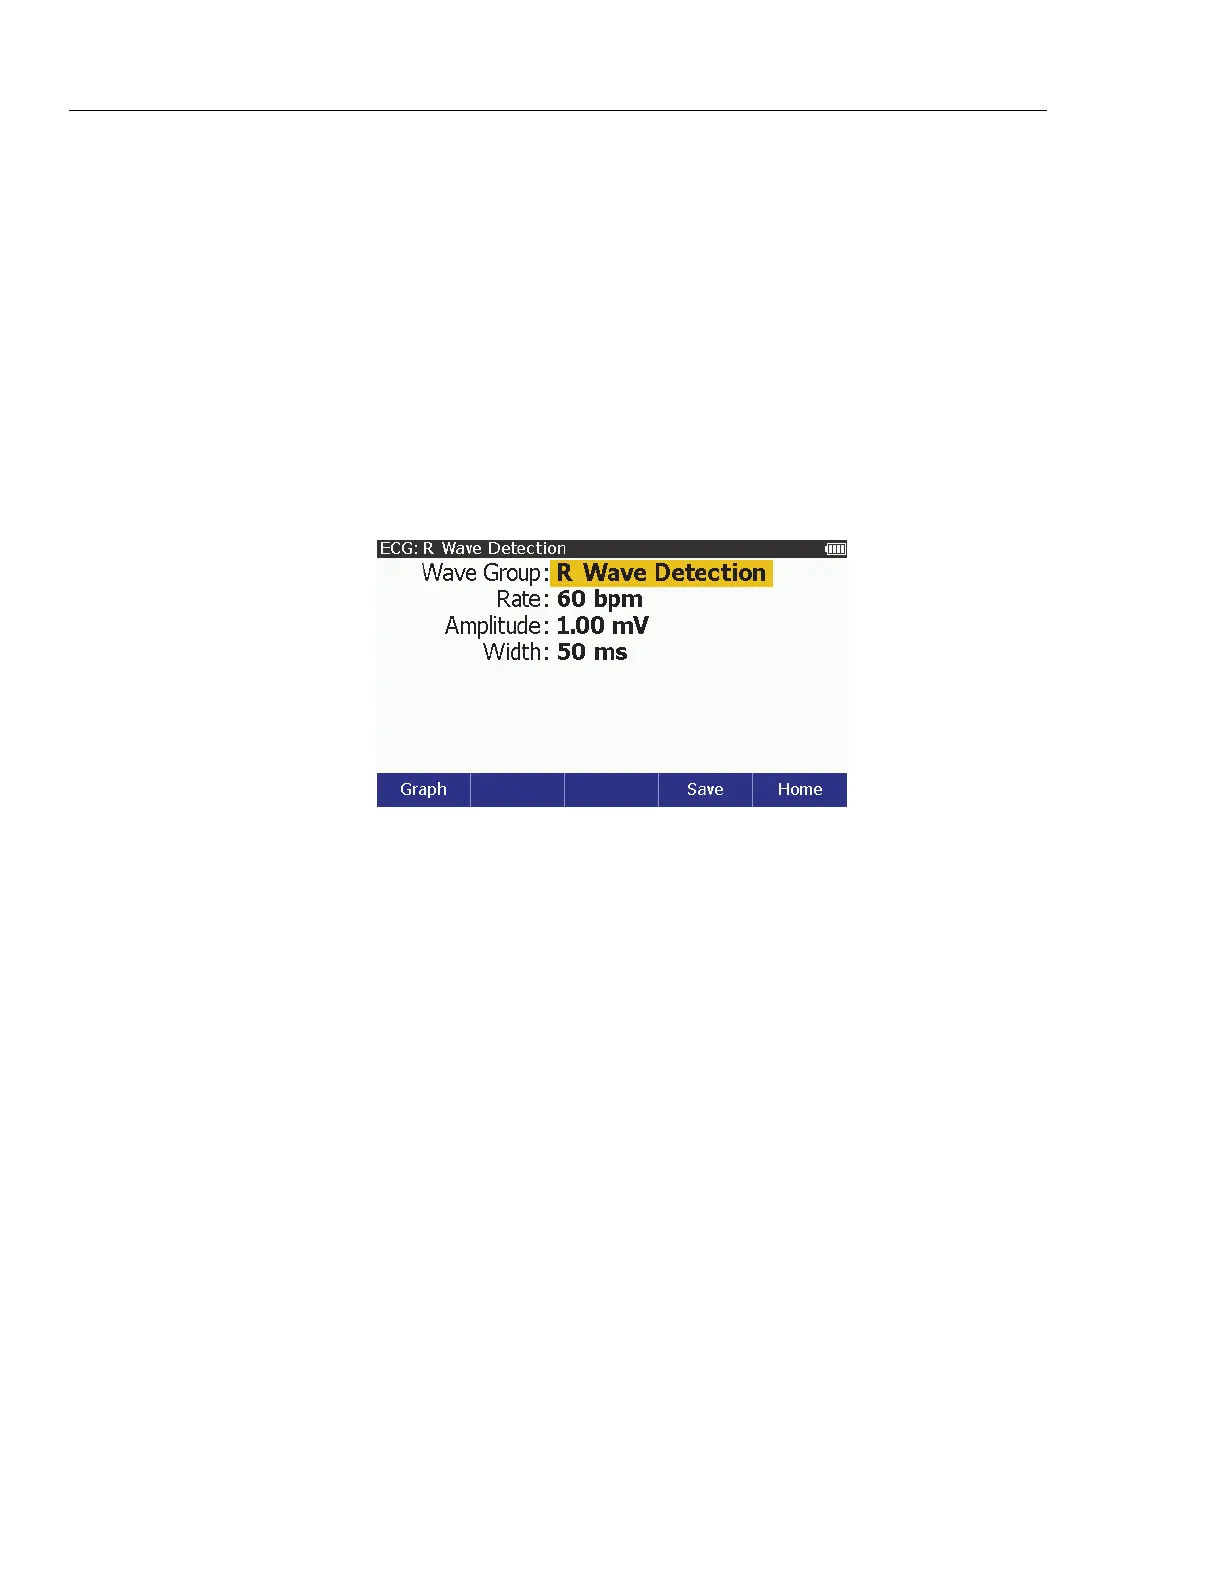
5. Push to show the ECG: R Wave Detection screen in Figure 9 on the
display.
glh020.bmp
Figure 9. R Wave Detection Screen
You can change the rate, amplitude, and width of the R wave. To change the
rate:
1. Push or to highlight the Rate value.
2. Push .
3. Push or to highlight 30, 60, 90, 120, 200, or 250 bpm in the list.
4. Push to set the rate and go back to the ECG: R Wave Detection screen.
To change the R wave amplitude:
1. Push or to highlight the Amplitude value.
2. Push .
3. Push or to adjust the amplitude. Each push of a key increases or
decreases the amplitude in the direction of the key pushed. The Product
simulates a heart signal amplitude of 0.05 mV to 0.25 mV by 0.05 mV
intervals and 0.05 mV to 5.00 mV that is set in 0.25 mV intervals.
4. When the amplitude is set, push to enter the value and go back to the
R Wave Detection screen.