35
Background or reference spectrum. This spectrum must not contain any of the measured
chemicals. It should be free of infrared absorbing gases to the extent that it is practical.
For that reason, the background gas is nitrogen.
Once the Background spectrum is taken, the spectra collected for each analysis (the
“scans”) are compared to the latest Background. If the air samples were the same as the
Background gas, the result would be a flat baseline along the x-axis of the ratioed
spectrum. But the gases are never the same, because the air samples always contain
some infrared absorbing gases, such as water vapor and carbon dioxide. The water vapor
in the air will always be higher than in the Background gas (it must be for the analysis
methods to work correctly). The peaks in the analysis spectrum contain the absorbance
peaks of the chemicals present in the air sample. This includes the standard gases in the
air, any measured chemicals currently present in the air sample, and any other chemicals
that exist in that air sample (“chemical strangers” with unknown odors, etc.). Compared to
the Background spectrum, the analysis spectrum results in the absorption “fingerprint” of
all chemicals in the air samples. This is the spectrum used for analysis by the analytical
methods.
3.4.4. Valve switching and timing
ACM 150 flow cycles identify the valves energized during each cycle. The flow schematic
for these valves may be obtained on request, including Sample Valves 1-10 and Sample
Valves 11-20, 21-30, and 31-40. All valves are shown in the de-energized state. For 3-
way valves, the de-energized state is C—common to NO— normally open, which changes
to C—every day to NC—normally closed when the valve is energized. The 2-way valves
are typically closed and energized to open.
The typical timing and pressure readings for the various modes of operation with the 5- 5-
meter gas cell are:
Table 1. Cycle Timing and Readings
Background Purge
(once every 2 hours)
30-60 stays at 0 or slightly positive
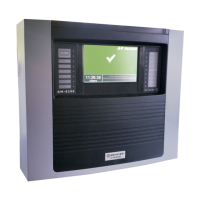
Observing the Cycle Valve Control Panel allows you to follow the modes for each area
scan. You can also observe this on the local or remote computer screen by selecting View
Cycle Valves.
The timing is set by the Honeywell service engineer in the configuration software. These
times may be increased or decreased to get good sampling and analysis results in the
minimum amount of time. The configuration software also allows you to change the
background mode's timing and frequency.

 Loading...