v 1.0 — February 2020 Altanium Matrix5
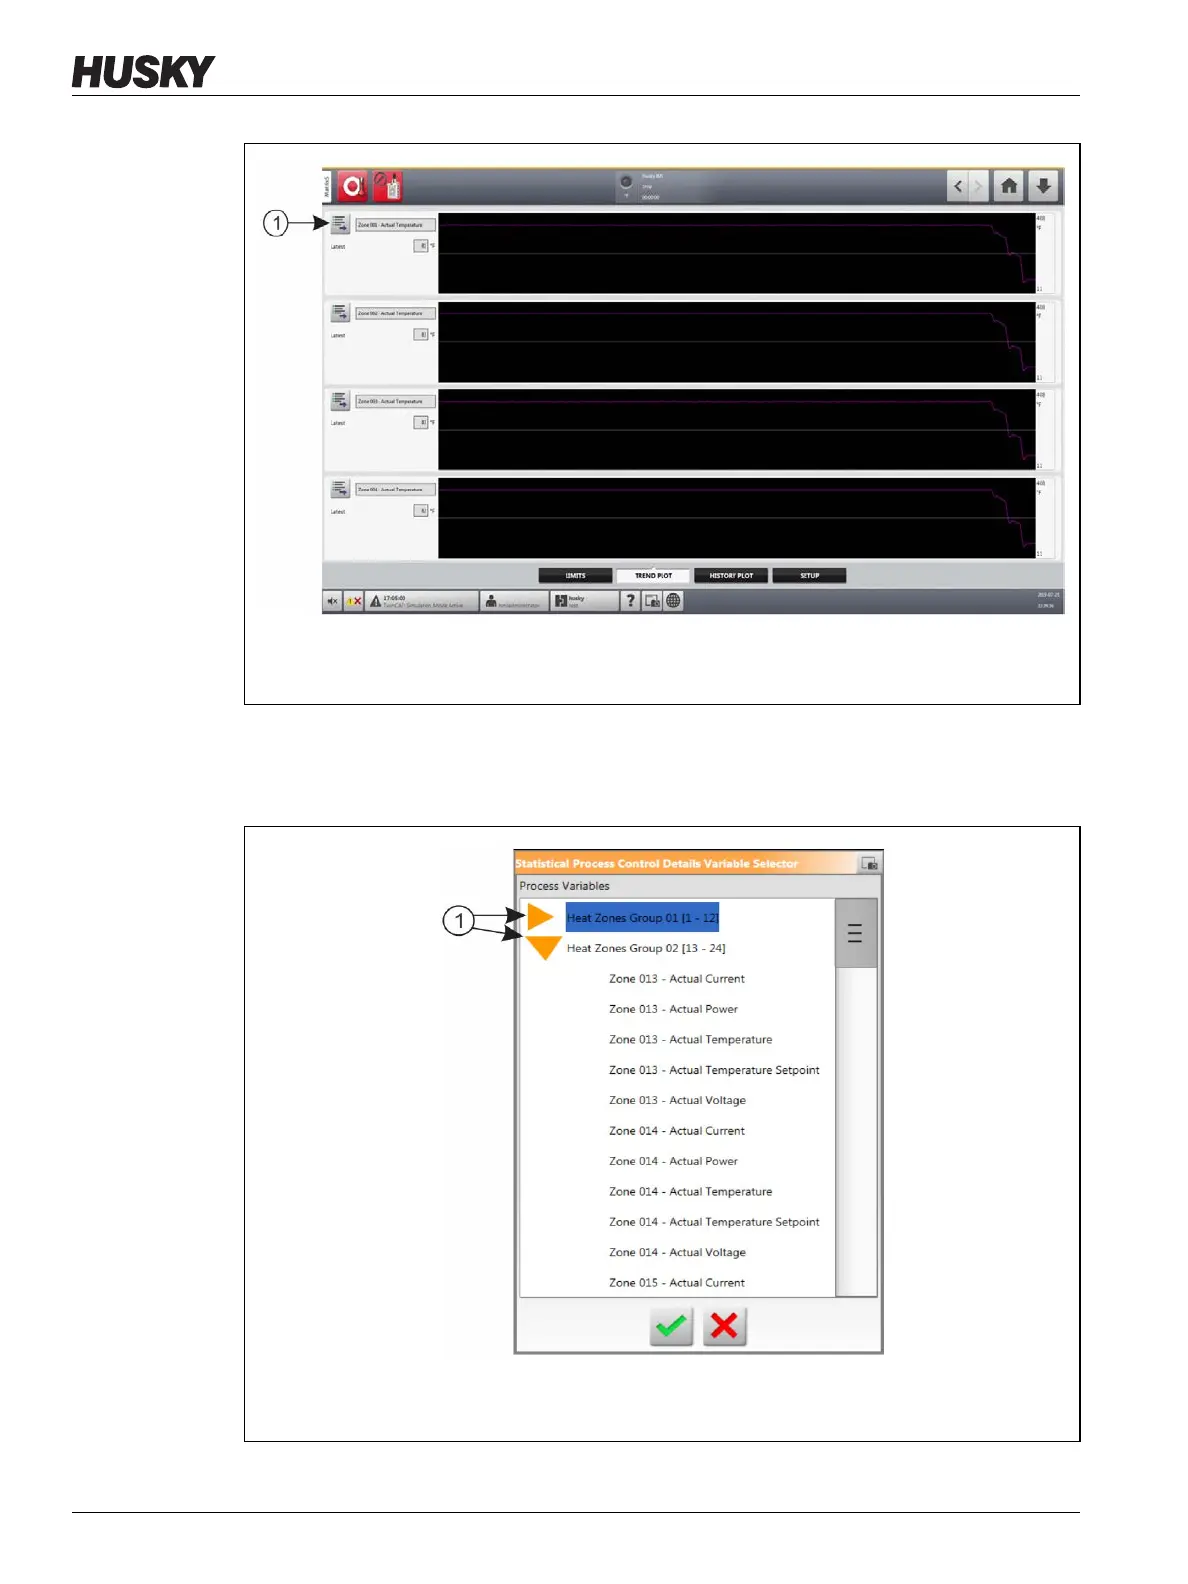
158 Set the Trend Plot
3. Touch the Variable Selection button.
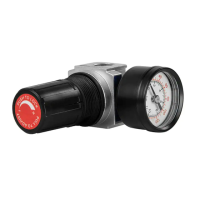
The Statistical Process Control Details Variable Selector dialog window shows. Refer to
Figure 12-2.
4. Touch the Minimize/Maximize buttons to navigate to the selection you want.
Figure 12-1 Trend Plot Screen
1. Variable Selection Button
Figure 12-2 Statistical Process Control Details Variable Selector Dialog Window
1. Minimize/Maximize Buttons