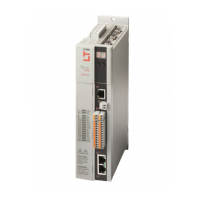
Image 7.28: “Noise amplitude, sampling time” screen
ID No.: 0842.26B.5-01Date: 09.2020
ServoOne- Device Help
141
7 Control
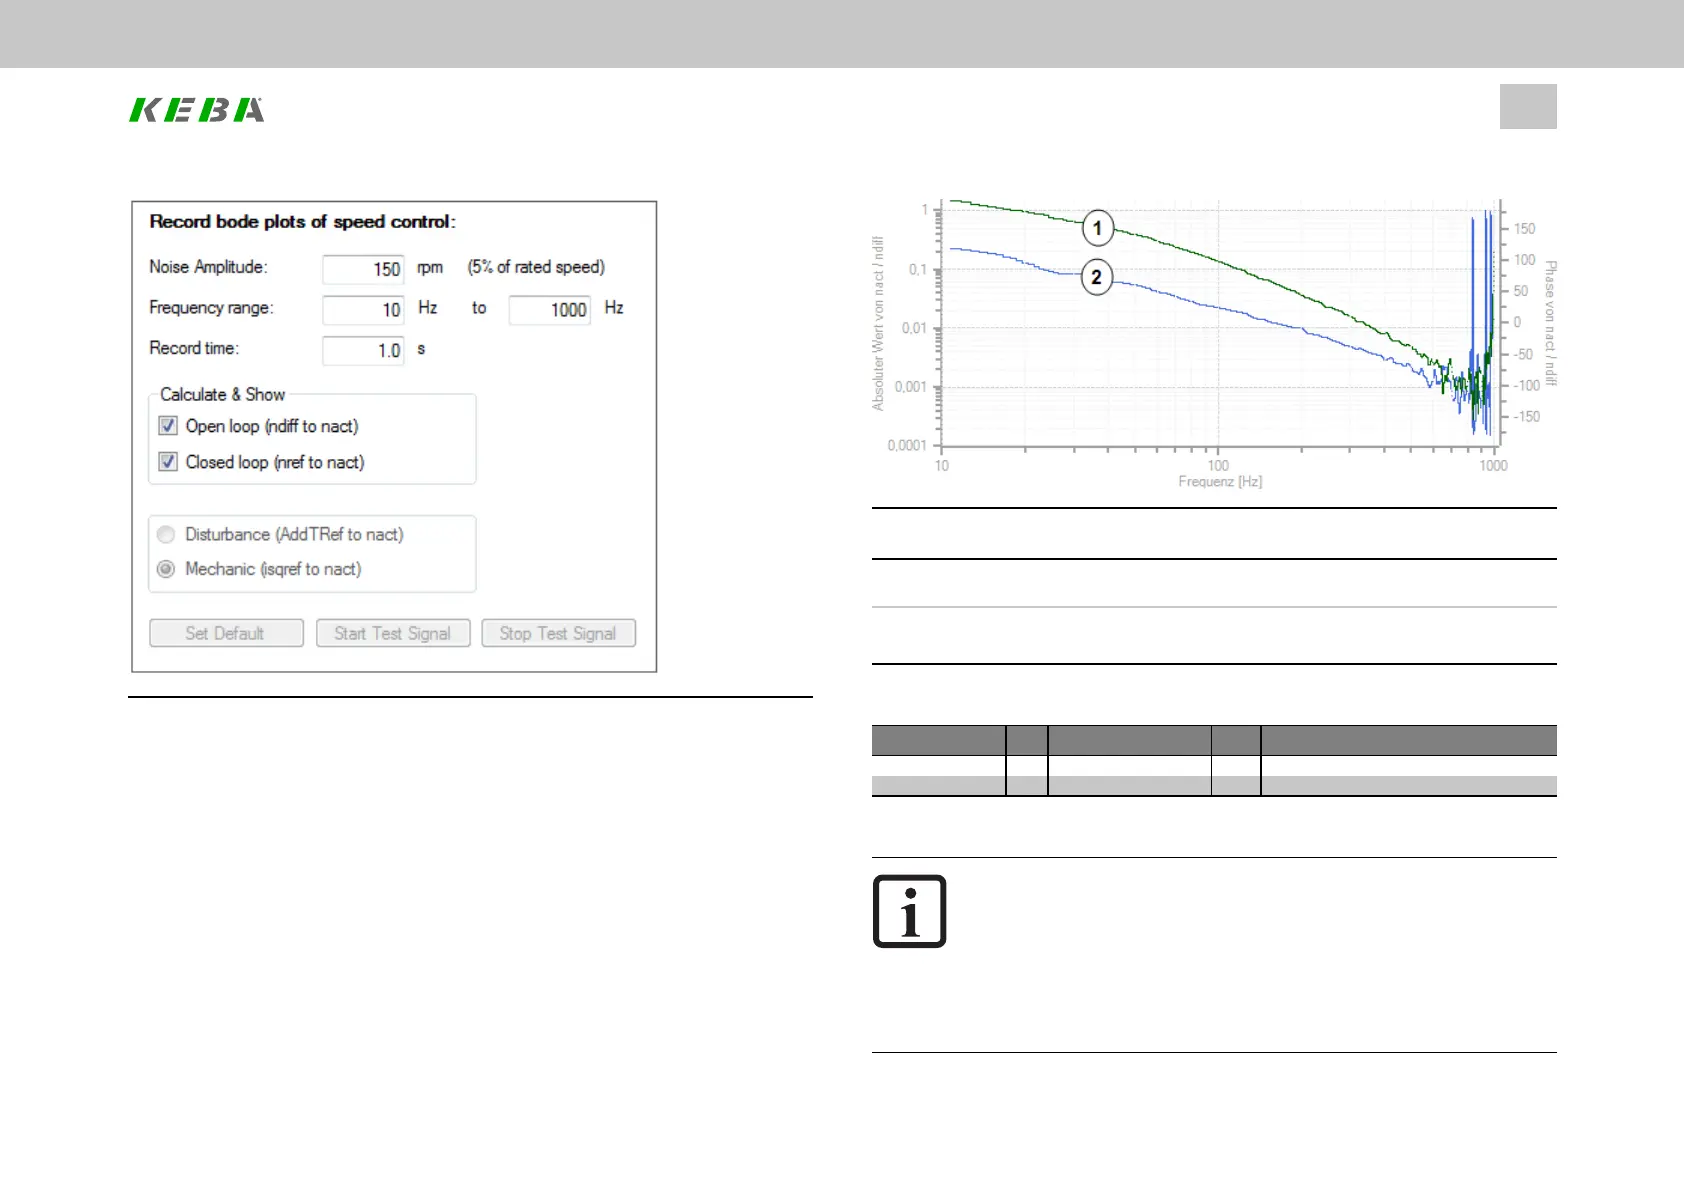
Image 7.29: Speed controller transfer function
①
Greencurve=amount
Y-axisleft=absolutevalueofnact/ndiff
②
Blue curve = phase response
Y-axis right = Phase response nact/ndiff
Legend for Speed controller transfer function
ID Index Name Unit Description
401 0 CON_SCON_AddTRef Nm(N) Additivetorquereference
402 0 CON_SCON_AddSRef 1/min Additivespeedreferencevalue(withoutramp)
Table 7.19: “Speed controller - Analysis of Speed control” parameter
NOTE
l
The speed control loop should be evaluated in the linear range.
Check to be sure that the torque in the recording does not reach
the limitation.
l
An overshoot of 40% is customary for dynamic applications.
(“Symmetrical optimum”)
 Loading...