Page 49
©2013 Technical Marine Service, Inc. LC-100 V2.97
Tank Table Explained
Accurate depth to volume/weight data is
required to calculate the volume and weight
of the tank’s contents. In regularly shaped
tanks, (regular in this case refers to a tank
with a linear depth to volume/weight curve),
the LevelCom 100 requires only Maximum
Depth, Maximum Volume/Weight and
Bubbler to Bottom be entered in order to
calculate the volume and weight at any
depth.
If the tank has an irregular shape, e.g.,
spherical, slanted or curved sides, a
hopper bottom, etc., then a Tank Table
must be established to ensure accurate
volume/weight calculations. The LevelCom
100 Tank Table allows the user to establish
ten (10) vertical levels within the tank that
define the shape. The top level is
Maximum Depth and Maximum
Volume/Weight, which defines the total
depth and volume/weight when the tank is
full.
The LevelCom 100 program interpolates
linearly between the Tank Table points.
Accordingly, as a general rule of thumb, the
Tank Table should be established by
placing the points of the Tank Table in the
areas with the greatest change. For
example, if the tank is a hopper, then the
Tank Table should be concentrated at the
bottom. If the tank requires a higher degree of accuracy at the top and bottom, as in a day
tank, then concentrate the points at the top and bottom to ensure high accuracy in those
areas.
The best source for the tank data can usually be found in the Tank Capacity Curve drawings.
While sometimes useful, we recommend you use caution if you are deriving the data from
the tank Sounding Tables. Consider the issues of the sounding tube length, the termination
point of the tube and curves in the sounding tubes. The LevelCom 100 works off of the
pressure exerted by the weight of the column of liquid over the end of the bubbler pipe.
Using sounding tube data can be misleading, the most common issue being the added length
due to curves inside the tank and the tube terminating outside the tank.
depth
ft.
volume
gal
MAX
D 9.75
MAX V
3023
D9 7.25 V9 2321
D8 6 V8 1816
D7 4 V7 1042
D6 2 V6 310
D5 1.5 V5 151
D4 1 V4 44
D3 0.5 V3 4
D2 0 V2 0
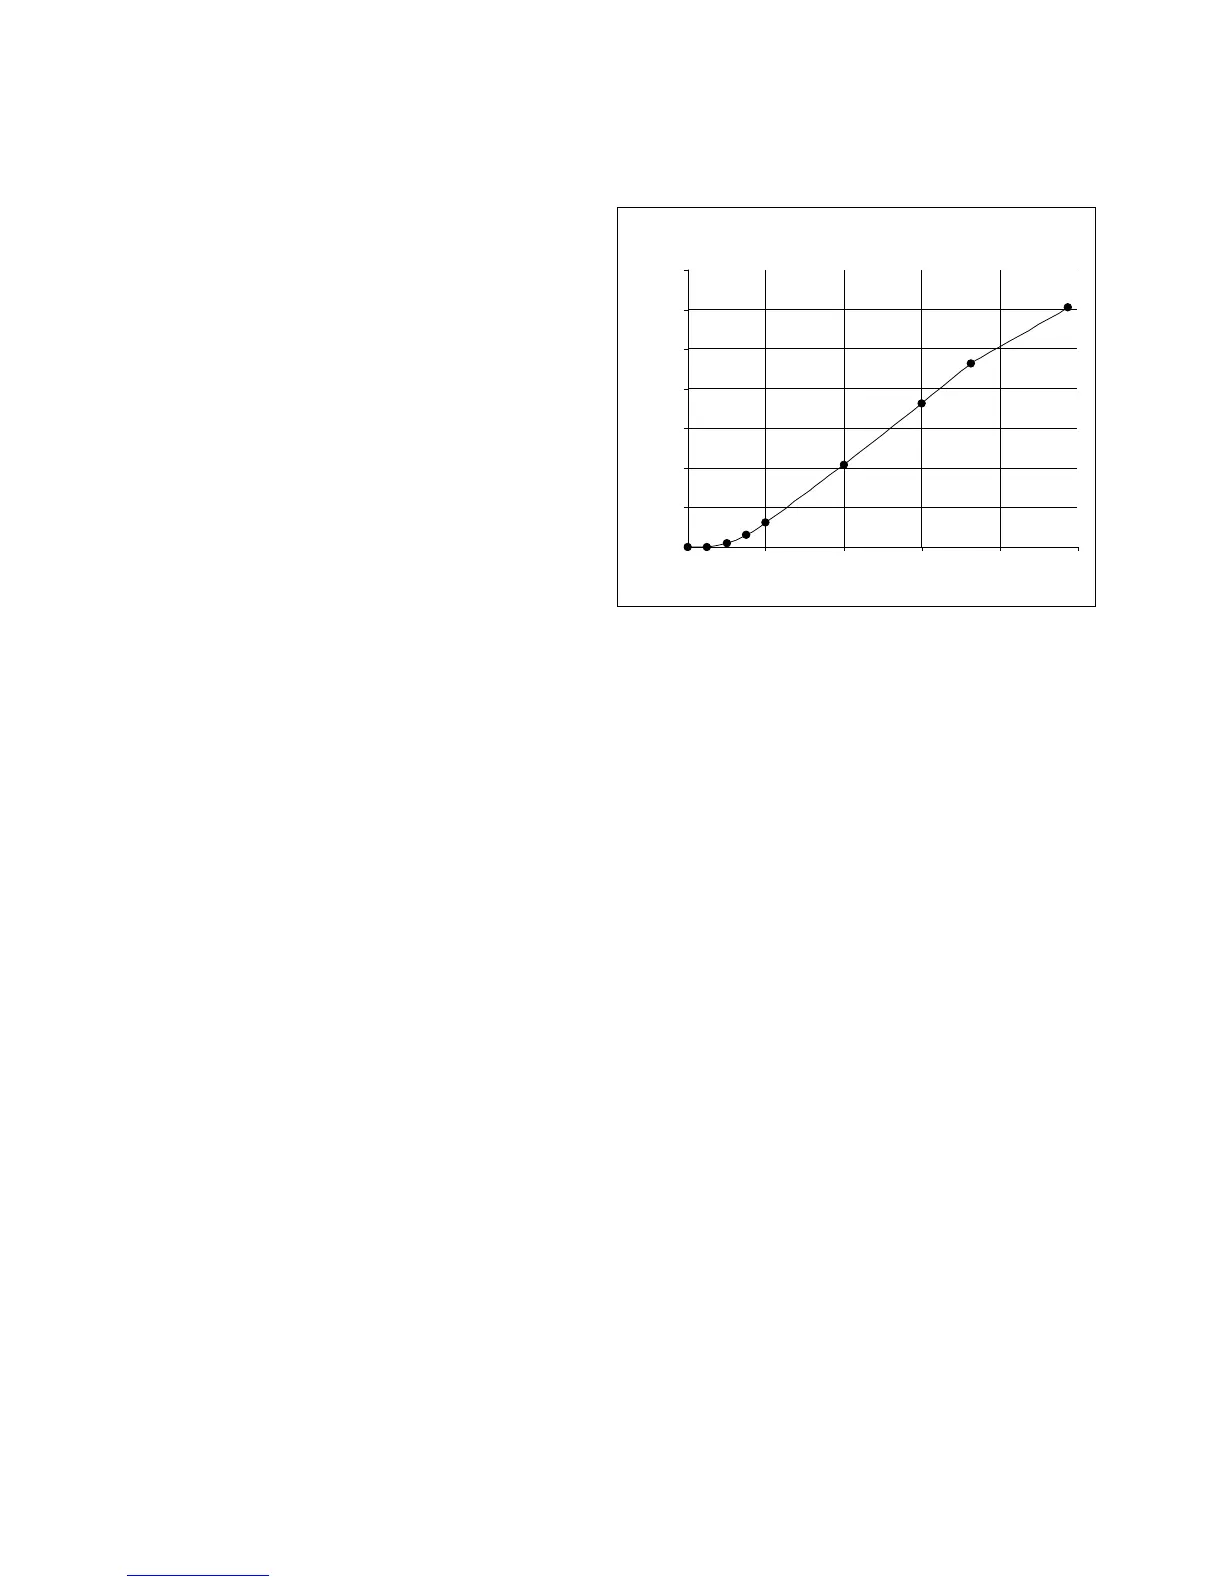
Figure 21 Tank Table Example
Tank Capacity Curve
0
500
1000
1500
2000
2500
3000
3500
0246810
Depth in Feet
Volume in Gallons