CRIMP DATA ANALYZER
CDA10
REV.01
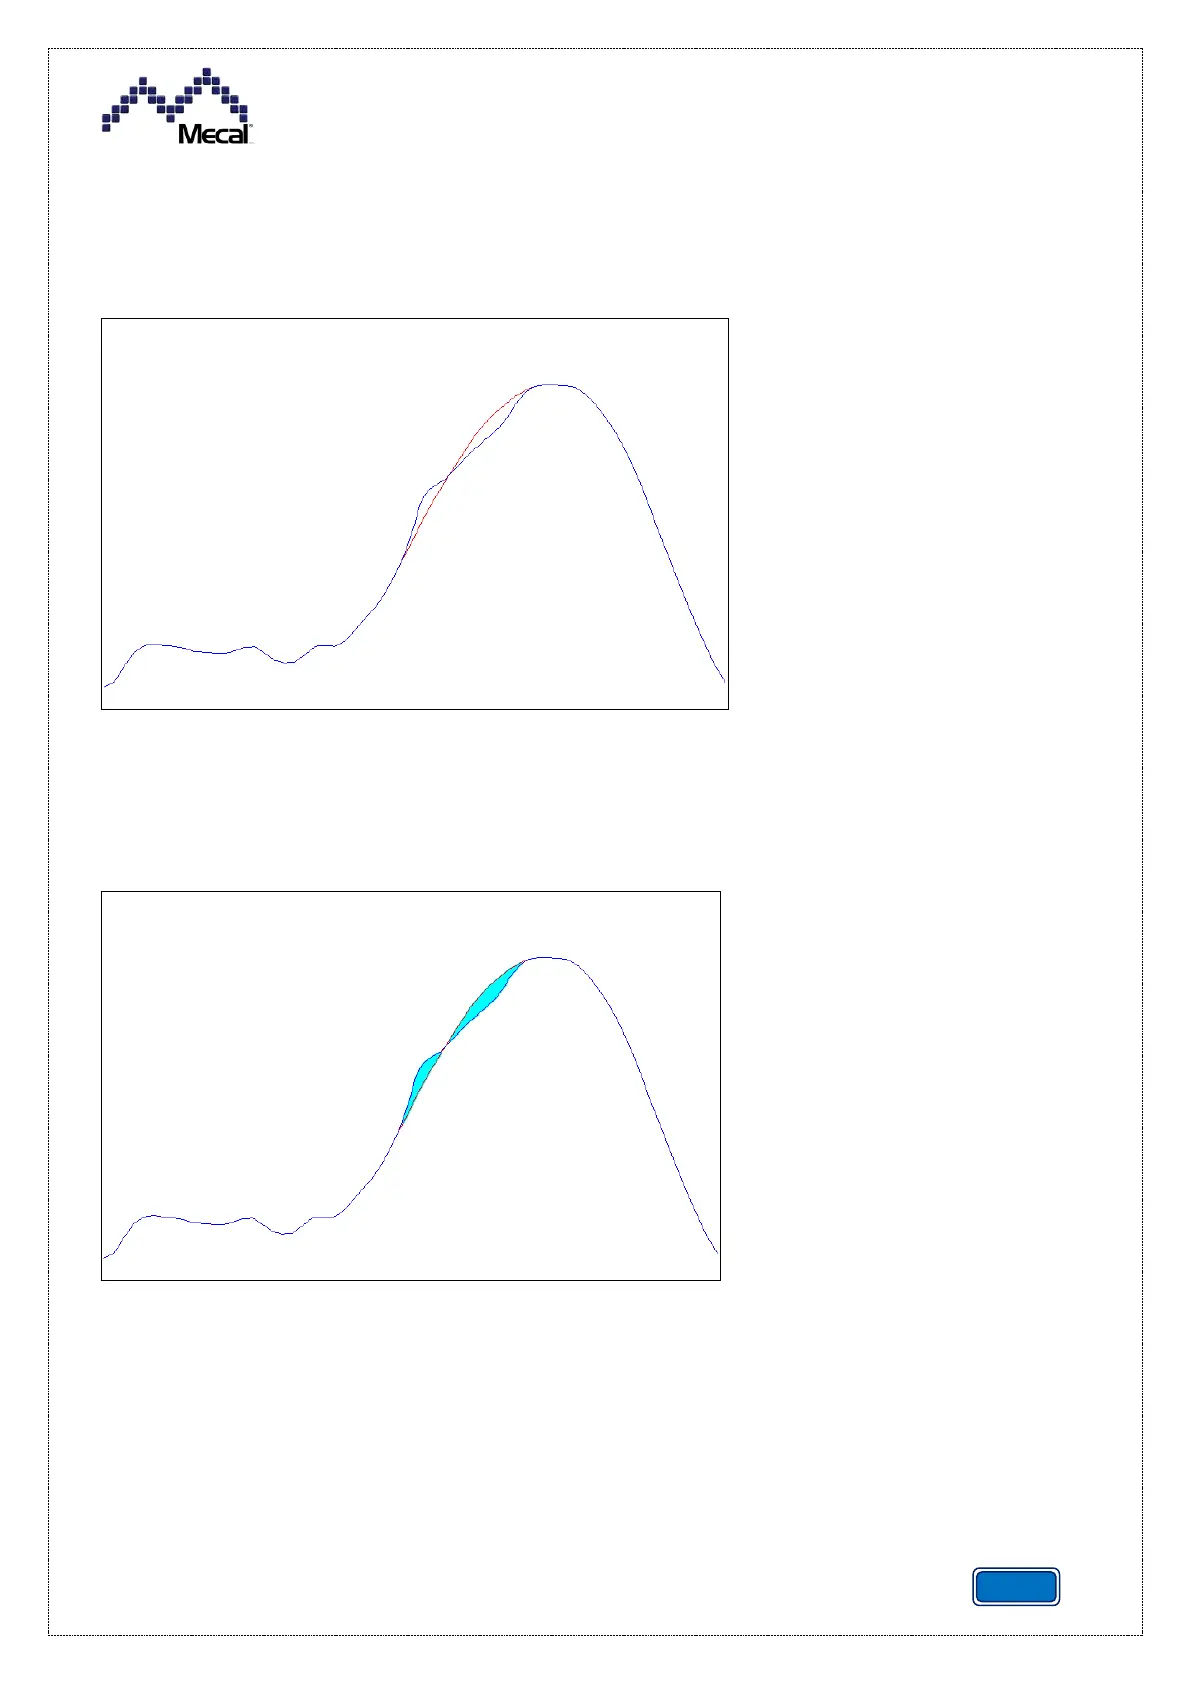
6.6.3 HOW CRIMP FORCE MISMATCH IS CALCULATED
The figure below shows a reference curve (in red) and a superimposed force curve for comparison
(blue). In this example, the blue curve could be typically associated with a crimping error on
insulation.
The figure below shows the area that is non-corresponding, which is given by the difference
between the two curves. The controller measures this area for each crimping cycle. The
algorithm does not take into account whether the error occurs above or below the reference curve,
but all errors are accumulated positively.