mode.
full compression. With a signal running through the compressor, a coloured line on
according to signal level.
3
4
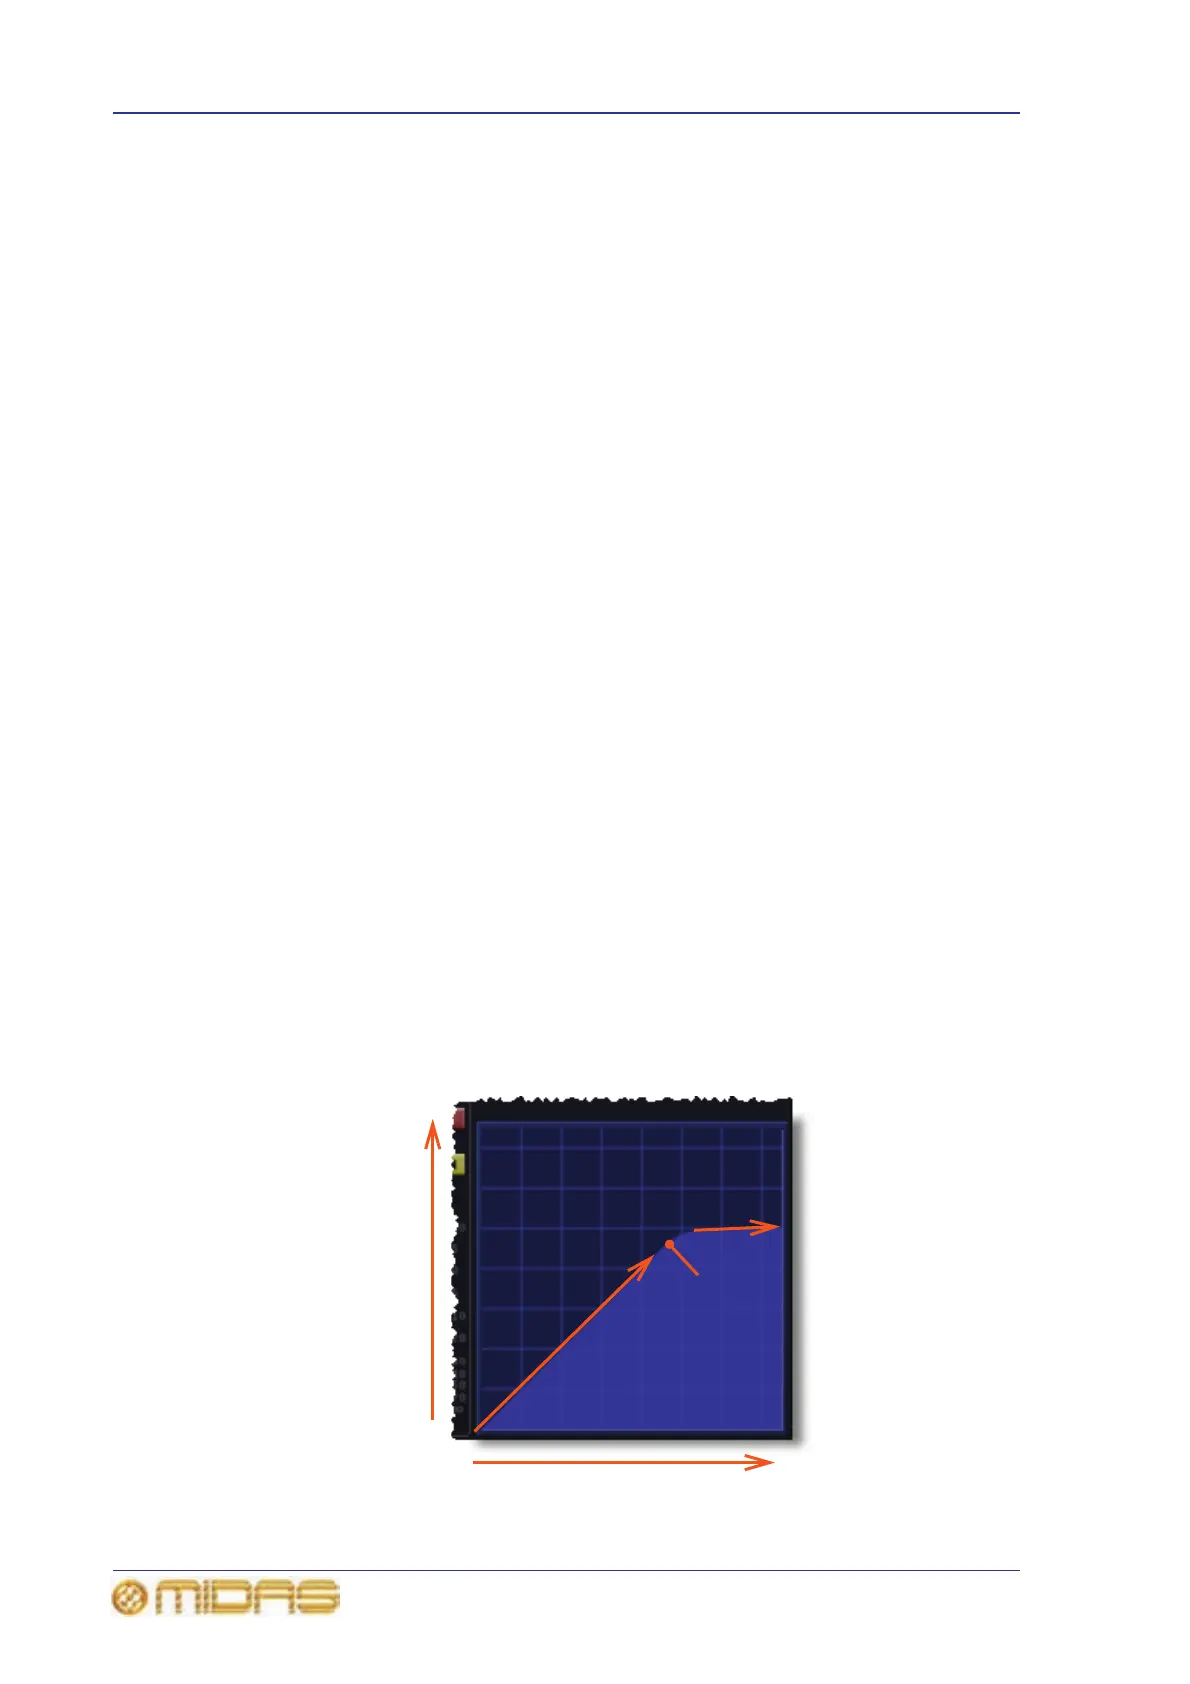
Graph with ratio applied
5
1 Input level = ‘x-axis’ of graph.
2 Output level = ‘y-axis’ of graph.
3 This portion of graph is pre-threshold and
is unaffected by compression, that is, with a
gradient of 1:1.
4 This portion of graph is post-threshold and
shows the effects of compression. The
gradient is the same as the compression ratio.
5 Threshold: The point where the gradient
changes and where compression starts to be
be applied.
6 Graph with no ratio applied, that is, 1:1
gradient. (What you put into the compressor,
you get out.)
7 A threshold reduction will move the
threshold point left, as shown in the example in
graph C (green line). Less signal is passed
1:1.
8 A threshold increase will move the
threshold point to right, as shown in the
example in graph C (yellow line). More signal
is passed 1:1.
9 Uncompressed: If signal doesn’t reach
threshold (point where gradient changes), the
line is green. As the threshold is not
exceeded, the signal is uncompressed.
10 Within knee area: If signal goes into
knee area to point where gradient changes
(more obvious with medium and soft knees),
compression starts to be applied and line
colour changes to yellow.
11 Fully compressed: If signal reaches the
point where gradient changes (over-threshold),
full compression at selected ratio is applied and
line colour changes to red.
1
2
A