2 - 18 Operator’s Manual
2 System Overview
2.13 Basic Screen & Operation
2.13.1 Monitor Display
The system monitor displays ultrasound images, parameters, menus and measurement results
window.
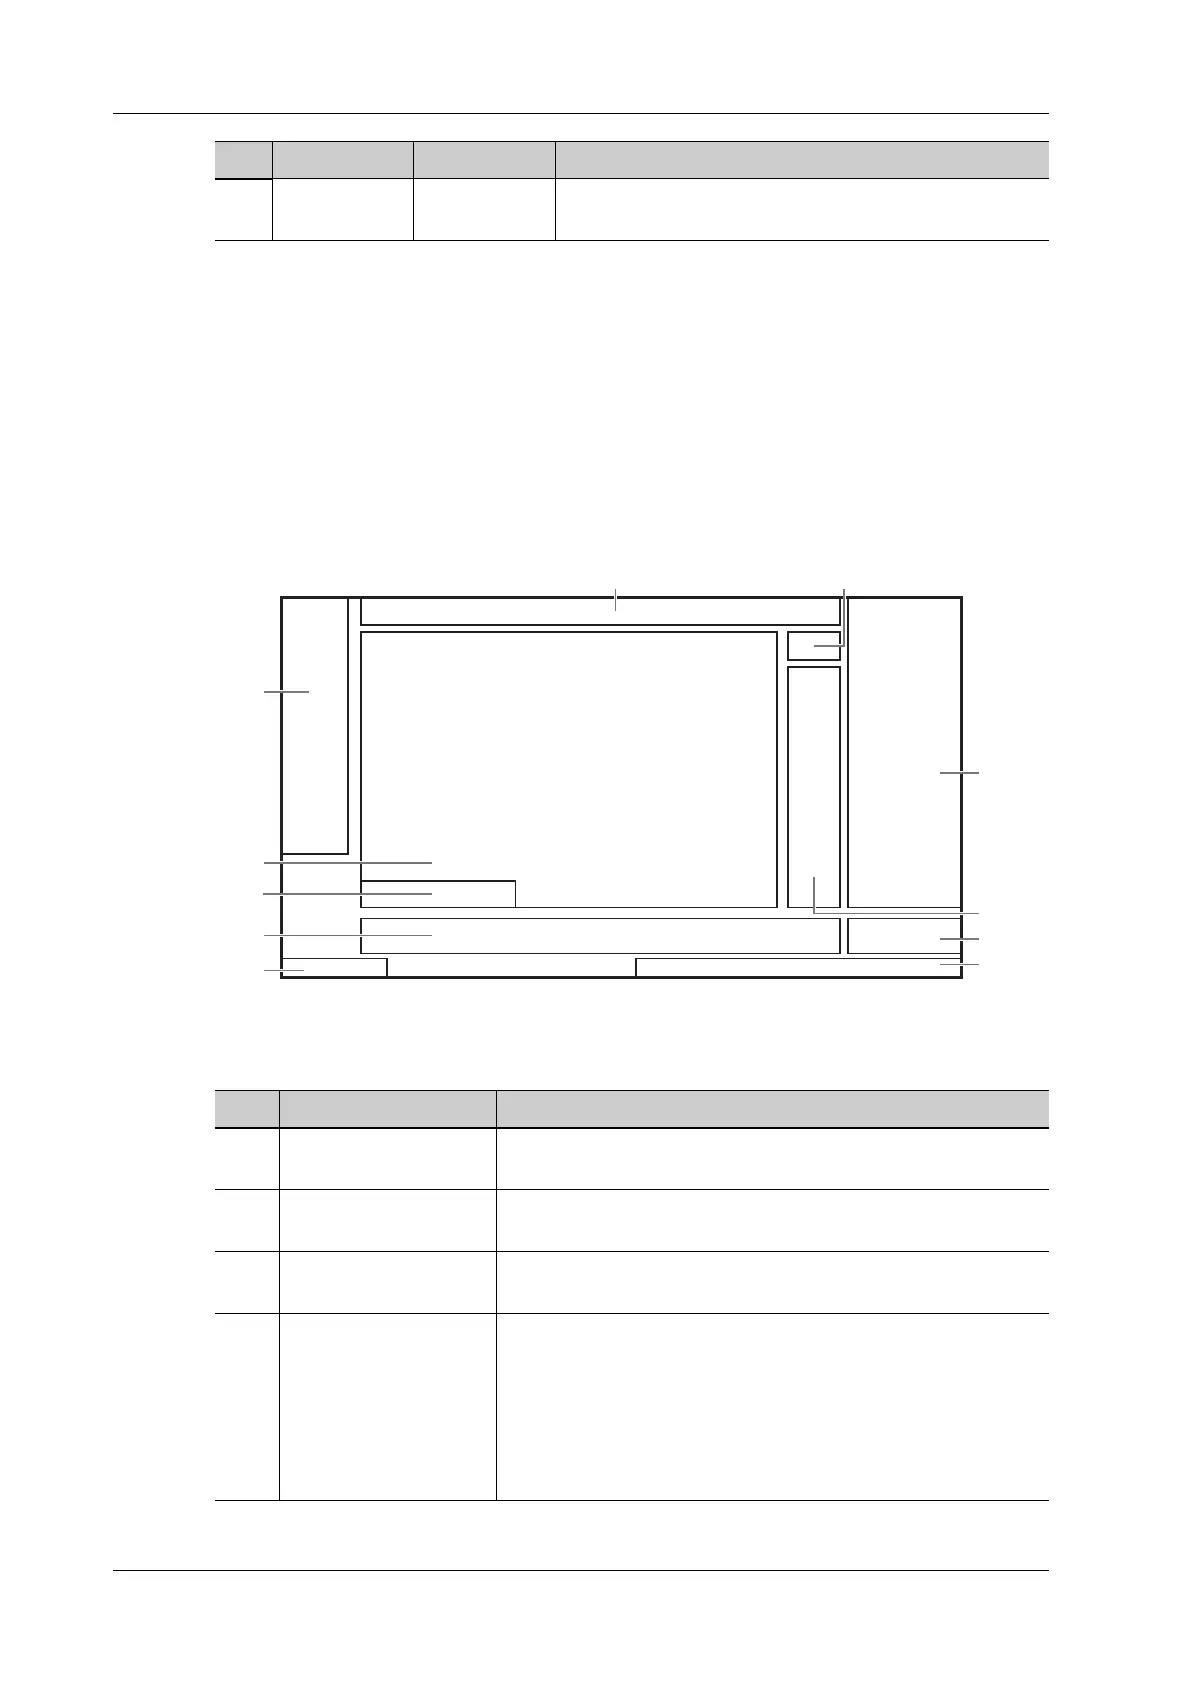
The following diagram maps out the different areas, such as patient information, image parameter
& menu, image area, thumbnail, help information, soft menu, and system status.
Figure 2-7 Monitor Display
2. ← Home Activate the Home function: return to start position of
comment.
No. Fn+ Name Function
No. Item Description
1. System Information
Area
Displays the manufacturer’s logo and product model.
2. Patient Information
Area
Displays the hospital name, the exam time, patient information,
the probe model, the exam mode, etc.
3. Menu Area Displays the image menu, measurement menu, comment menu,
body mark menu and so on.
4. Image Area Displays the ultrasound images, ECG waveforms, probe mark
(or active window mark), time line (in M or PW mode),
coordinate axis (including depth, time, velocity/frequency),
acoustic power (including the acoustic power, MI (Mechanical
Index) and TI (Thermal Index), besides, the comment,
bodymark, measurement calipers, color bar/grayscale bar are
also displayed here.
3
4
5
6
7
8
11
10
9
2
1
 Loading...