Doc. Name: NMC-PRO ׀ User Guide Ver 3.05.03 Revision: 2.2 Page: 7
Crop Management Technologies
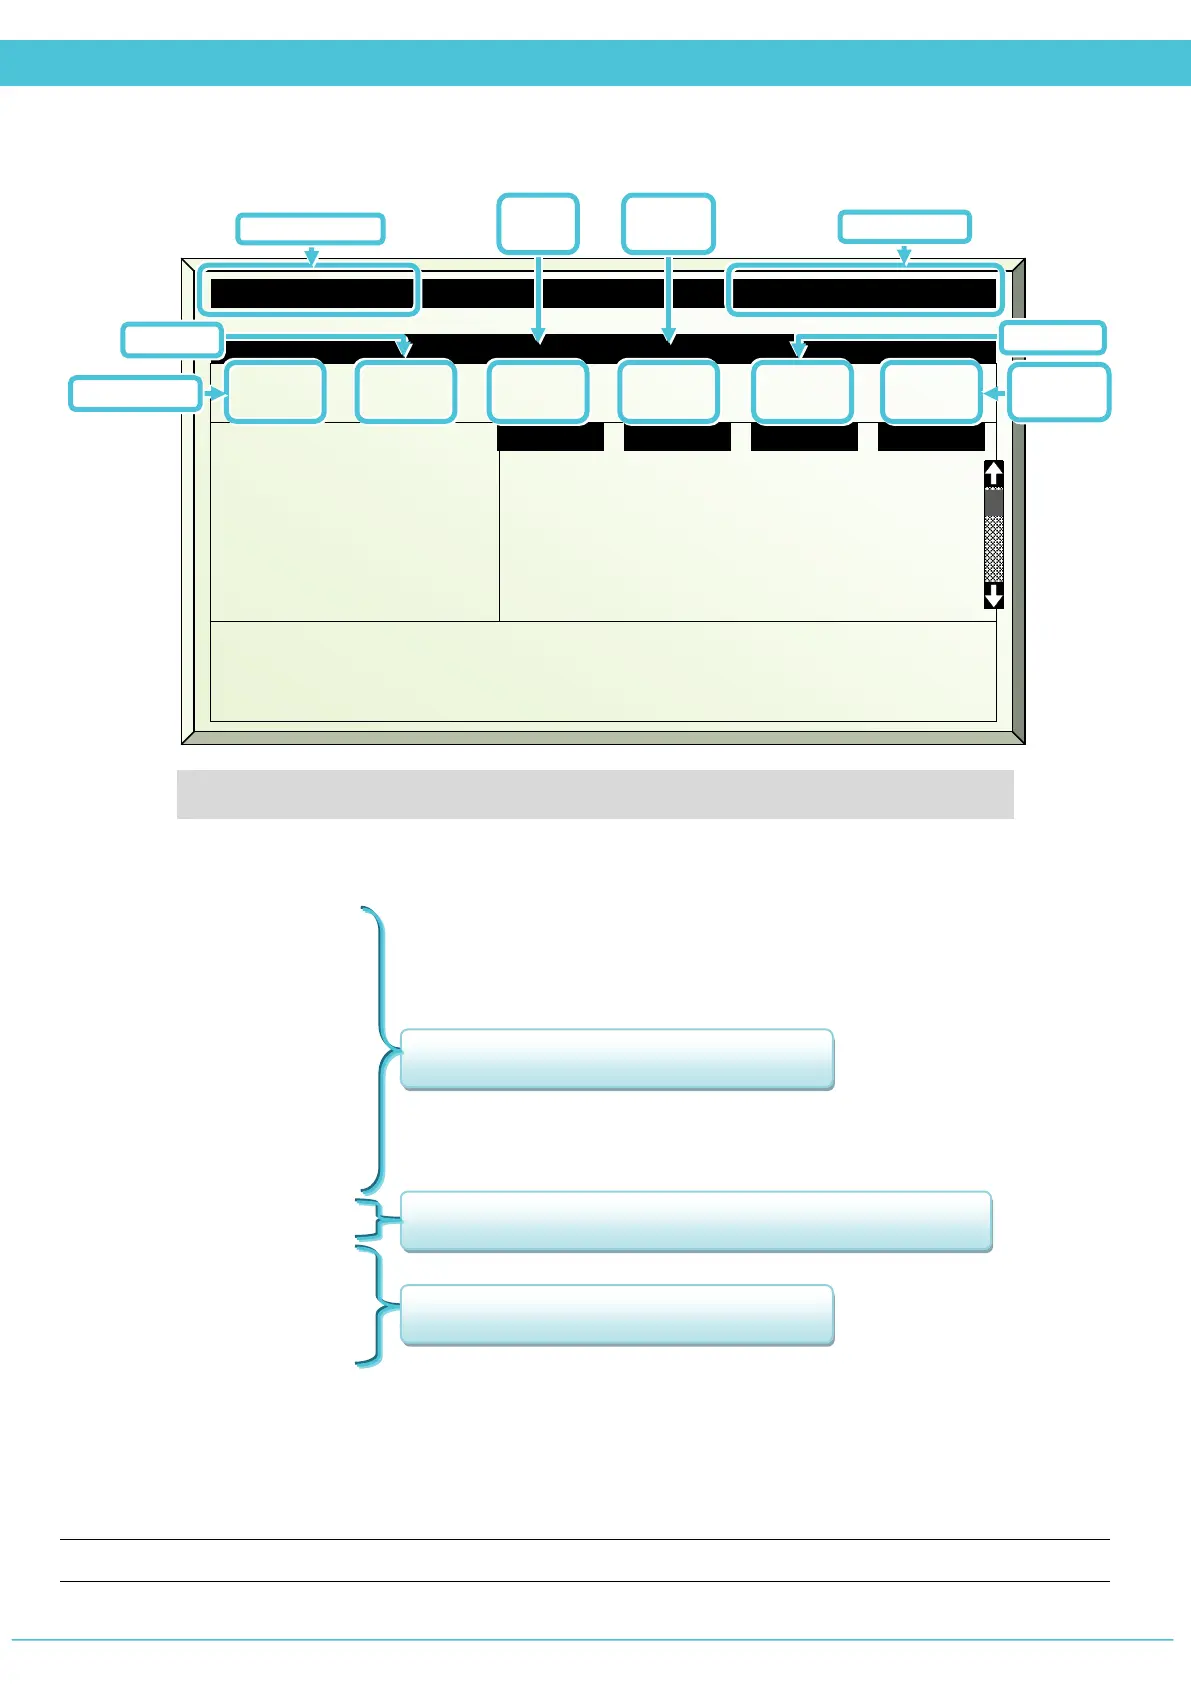
Overview Screen
NOTE: The following sensor readings will appear on the Overview Screen only if defined in the
Customize Overview menu 7.13
1.
Temp
o
C - Average temperature in each zone
2.
Hum % - Relative Humidity percentage in each zone
3.
VPD Kp - Vapor Pressure Deficit* in each zone
4.
V.Top1 wind %
5.
V.Top1 lee %
6.
V.Top2 wind %
7.
V.Top2 lee %
8.
V.Top3 wind %
9.
V.Top3 lee %
10.
V.Top4 wind %
11.
V.Top4 lee %
12.
V.End wind %
13.
V.End lee %
14.
V.Long wind %
15.
V.Long lee %
16.
Screen 1 %
17.
Screen 2 %
18.
HeatNet 1
o
C
19.
HeatNet 2
o
C
20.
HeatNet 3
o
C
21.
HeatNet 4
o
C
22.
HeatFloat
o
C
23.
Heat On/Off - Displays activity of the ON/OFF Heating system in each zone [ON/OFF]
24.
Misting - Displays the total number of active Misting Systems in each zone [0-4]
25.
Fan stage - Displays the total number of active fan stages in each zone [0-8]
26.
CO2 ppm – Displays the measured C02 concentration level in each zone
27.
Crop Protection - Displays whether Crop Protection is enabled/disabled in each zone [Yes/No]
28.
Light – Displays the total number of active Light strings in each zone [0-3]
*VPD is the difference (deficit) between the amount of moisture in the air and how much moisture the air can hold when it is saturated. Once air becomes
saturated water will condense out to form clouds, dew or films of water over leaves.
12.0
40.5
3.2
Est
670
1400
1. Temp °C
2. Hum %
3. VPD Kp
4. V. Top1 lee%
5. V. Top1 wind
6.
Screen 1%
23.0
45.0
1.9
70
45
85
22.7
46.0
2.0
100
65
100
24.5
44.6
1.8
85
56
90
22.9
46.9
1.7
88
100
100
Displays vent position in each zone
0% represents fully closed and 100% is fully opened
Displays screen position in each zone. Collected screen position is represented
by 0% (fully closed) and a spread screen is 100% (fully opened)
Displays measured water temperature in the pipes of
the heating network in each zone
Direction
Speed