NIRStar 14.1 - User Manual
Page 96 of 124
Please note that the numbers of rows and columns in Topo Layout determine the size of each graph in
the Block Average Display. Therefore, we advise you not to insert any blank rows/columns.
The label in each graph gives the source- and detector-optode numbers for the corresponding channel.
For example, 5-7 displays block-averaged data for the channel defined by Source 5 and Detector 7.
After block-averaged data are plotted in the display window (i.e., at least two triggers for the same
marker have been received), the trigger position with respect to the data is marked in every graph with a
vertical dashed line at t = 0.
Traces colors
Consistent with other NIRStar displays available, the HbO traces are displayed in red and Hb in blue. If
two markers are being displayed, the traces corresponding to the second marker will be distinguished
from those for the first by being displayed in deep red (maroon) and deep blue.
Graphs Legend
In ‘Graphs Legend’, the time scale and the resulting concentration change (mmol/L), after applying the
scale factor selected in the Advanced Displays window, are shown. The scales correspond to the initial
and final values depicted in each graph. For instance, in Figure 73, the displayed data are limited from -5s
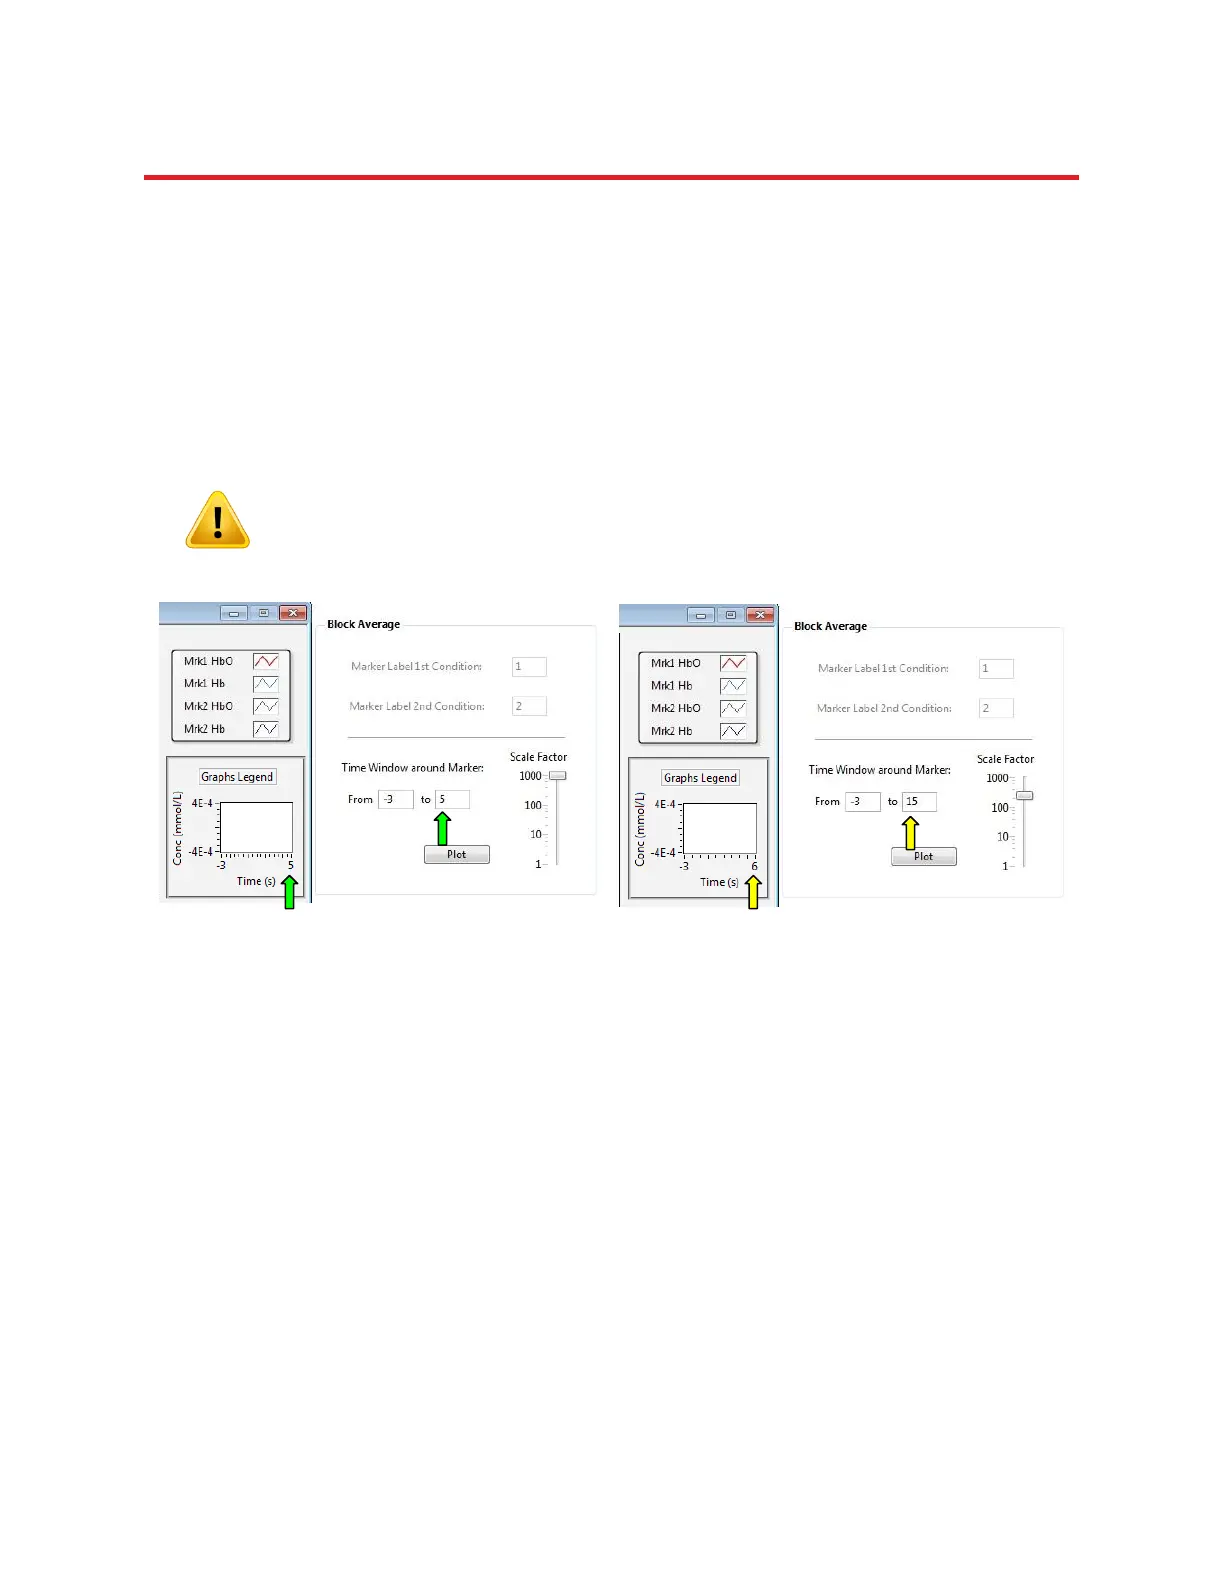
to 30s. Figure 74 depicts the correspondence between the period actually displayed (Graphs Legend) and
the period entered by the user (‘Time Window around Marker’). On the left, the green arrows indicates
the agreement between the user-specified and displayed period. The right side shows the case where
the actual time between consecutive triggers (6s) is less than the specified width of the time scale (5 s);
in this case, the scale will be adjusted to the smaller value.
Please note that the number of triggers for each marker displayed in the bottom-
right corner of the window may be one less than the number of triggers received
if the “Max Display” period following the last trigger has not been reached yet.
Figure 74. Plot Legends and user-defined values