9.1.4 ORP [mV], ORP [mA]
Measured variables ORP [mV], ORP [mA]
If the measured variable
‘ ORP [mV]’
or
‘ORP
[mA]’
is selected, measurement of the process
temperature is only possible for information or
recording purposes.
For the measured variable
‘ORP [mV]’
, the
measuring range is fixed in the range -1500
mV ... + 1500 mV.
For the measured variable
‘ORP [mA]’
, the
measuring range is dependent on the RH-V1
measuring transducer and is 0 ... +1000 mV.
9.1.5 Chlorine, bromine, chlorine
dioxide, chlorite, dissolved
oxygen and ozone
Measured variable chlorine, bromine, chlorine
dioxide, chlorite, dissolved oxygen and ozone:
The measured variables chlorine , bromine,
chlorine dioxide, chlorite, dissolved oxygen and
ozone are always measured using a mA signal
because the measuring transducer is located in
the sensor.
The temperature compensation takes place
automatically inside the sensor (exception:
CDP, chlorine dioxide sensor). For further infor‐
mation see the operating instructions of the
sensor used.
Measurement of chlorine with pH compensation
Chlorine used in water disinfection comes in
various forms, e.g. as liquid sodium-calcium
hypochlorite, as dissolved calcium hypochlorite
or as chlorine gas. All of these forms can be
measured using DULCOTEST chlorine sen‐
sors. After the addition of chlorine to water, the
chlorine splits into two fractions depending on
the pH value:
n 1. Into hypochlorous acid (HOCl) a
strongly oxidising, efficient, anti-bacterial
agent that destroys most organisms very
quickly.
n 2. Into the hypochlorite anion (OCl-) – with
a weak anti-bacterial effect that takes a
long time to kill off organisms.
The sensors for measuring free chlorine selec‐
tively measure the very effective hypochlorous
acid (HOCl), but not the hypochlorite anion. If
the pH value changes during the process, then
the ratio of the two chlorine fractions changes
and hence the sensitivity (slope) of the chlorine
sensor. If the pH value increases, the meas‐
ured HOCI concentration decreases. If there is
an integrated control, then the control tries to
compensate for this. If the pH value now
decreases, the result can be a considerable
overdosing of chlorine, even though no extra
dosing has taken place. Use of a pH compen‐
sated chlorine measurement can prevent this.
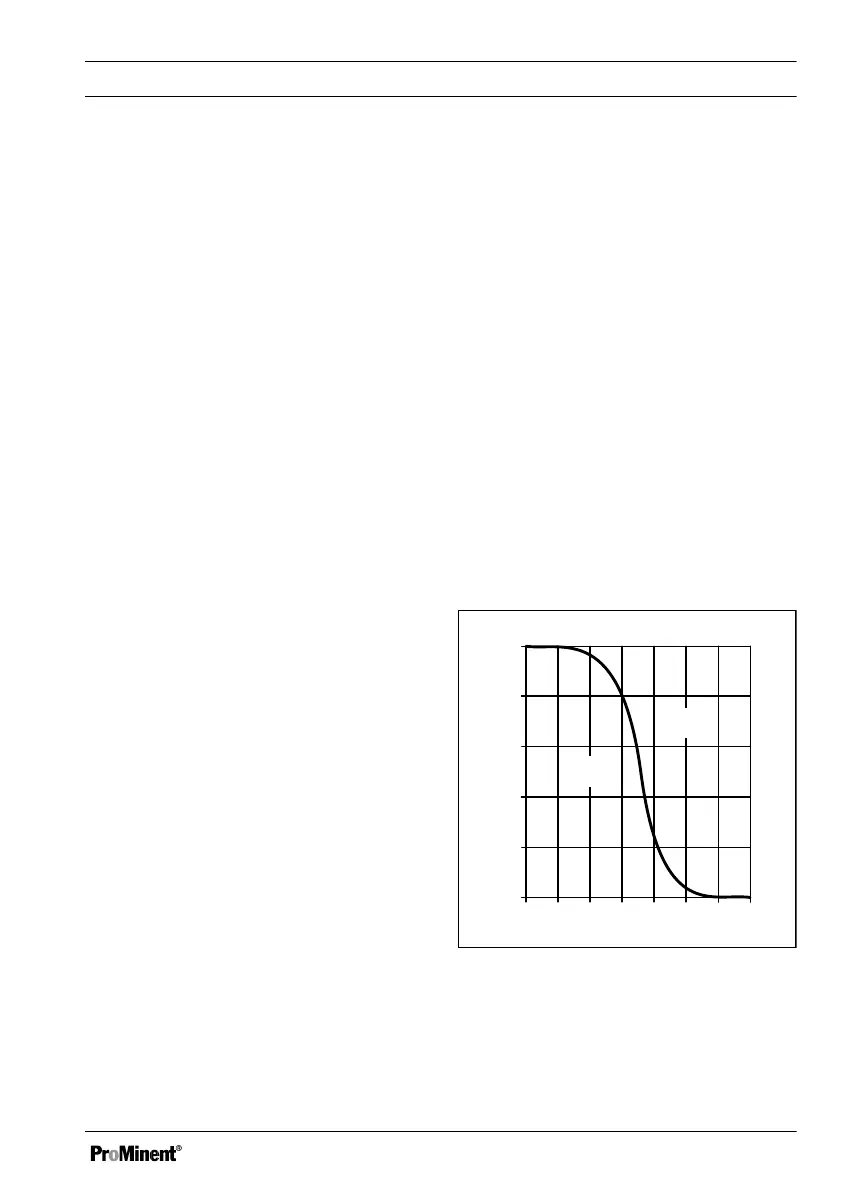
4 5 6 7 8 9 10 11
0 20 40 60 80
100
OCl
-
HOCl
HOCl %
pH
Fig. 32: HOCl/OCL equilibrium
-
As the graph shows, for pH values of > 8.5,
less than 10% of the HOCl is contained in the
water and hence the disinfecting power is
lower. The chlorine value shown after compen‐
sation is a calculated chlorine value. The calcu‐
Configuring measured variables
73