83
Managing with WebPAM PROeVess A6120 Product Manual
• CacheUsage
• DirtyCacheUsage
• PartNumber
• SerialNumber
• HardwareRevision
• WWN
• InstallPackageVersion
• InstallPackageBuildDate
• MemoryType
• MemorySize
• FlashType
• FlashSize
• PreferredCacheLineSize
• CacheLineSize
• Coercion Enabled/Disabled*
• CoercionMethod*
• SMARTLogEnabled/Disabled*
• SMARTPollingInterval *
• WriteBackCacheFlushInterval*
• EnclosurePollinginterval
• HostCacheFlushing Enabled/Disabled*
• ForcedReadAhead Enabled/Disabled*
• SpinDownType
• HDDPowerLevels*
• HDDIdleTime*
• HDDStandbyTime*
• HDDStoppedTime*
• PhysicalDriveTemperatureThreshold*
• PhysicalDriveCriticalTemperatureThreshold*
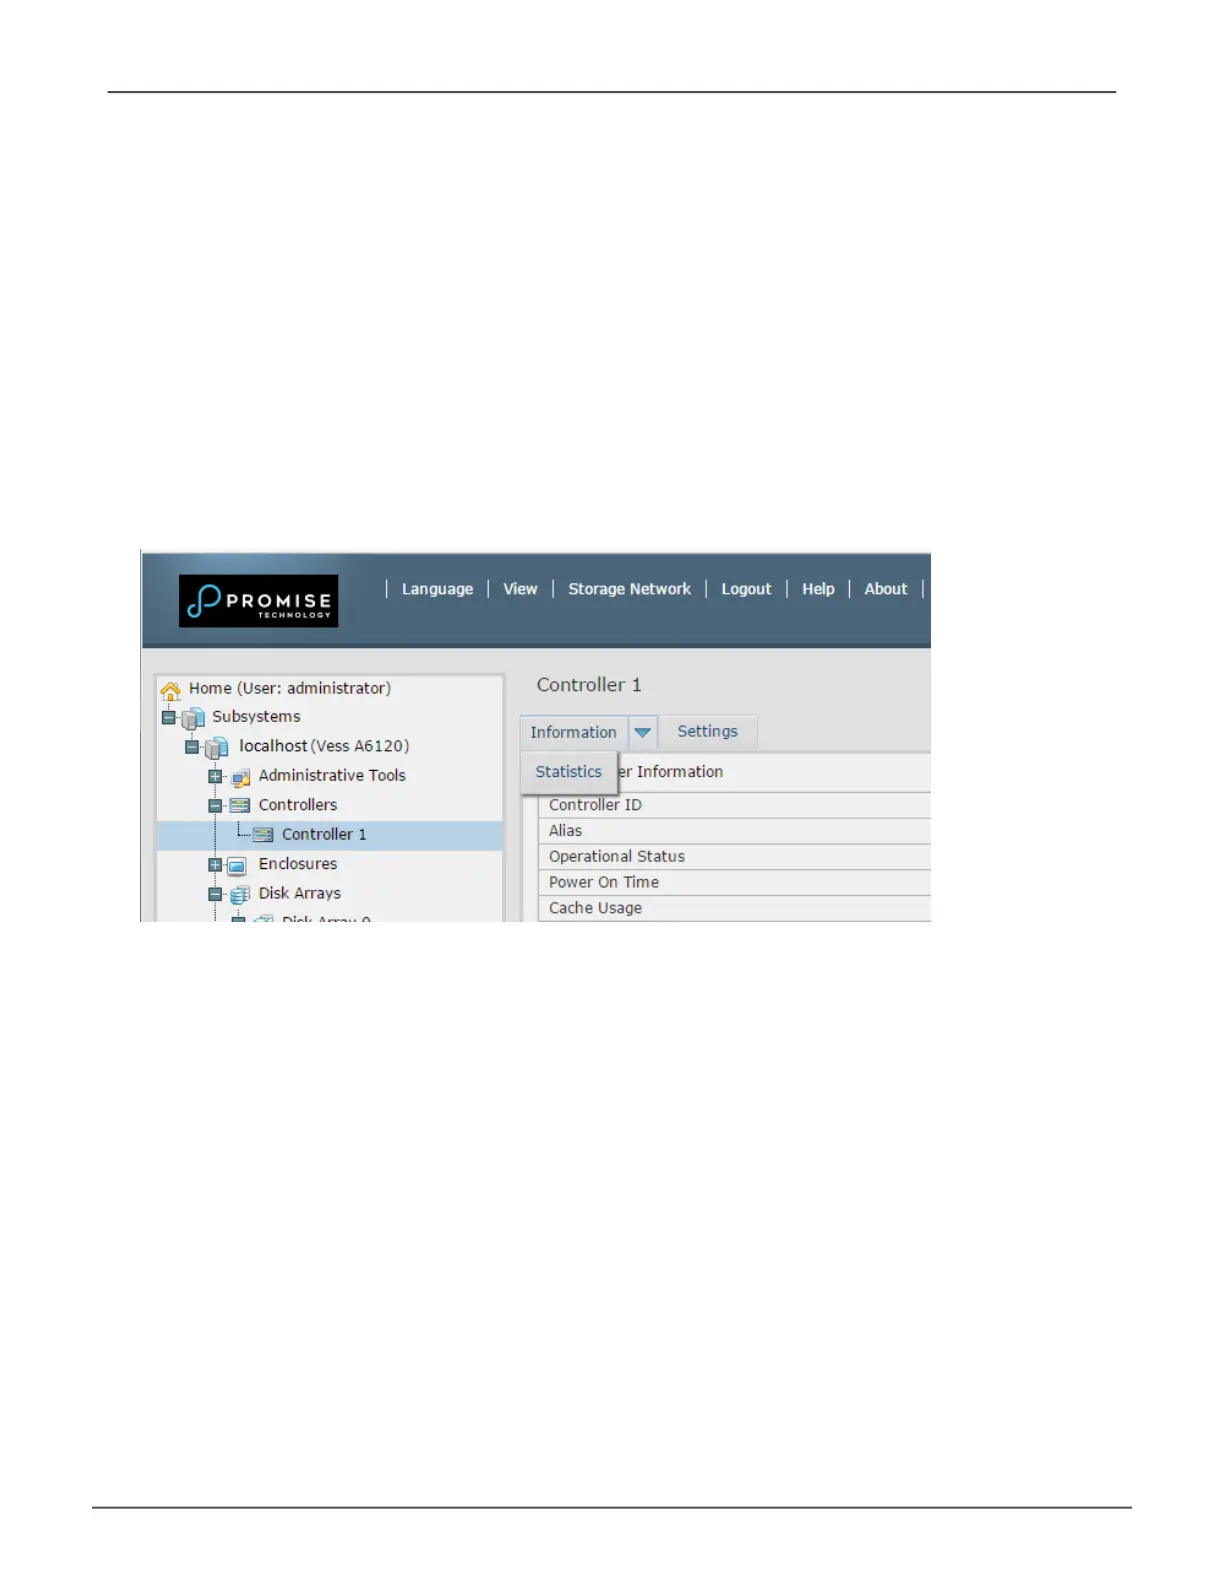
viewing COntrOller StatiStiCS
To view controller statistics:
1. Click the Controllers icon.
2. Click the specic Controller icon of the controller for which you want to view statistics.
3. At the top of the Information display menu, between the Information and Settings tabs, click on the
menu expander to reveal the Statistics link.
Reveal Stascs link
Controller statistics include:
• DataTransferred
• ReadDataTransferred
• Errors
• ReadErrors
• I/ORequests
• ReadIORequests
• StatisticsStartTime
• WriteDataTransferred
• Non-Read/WriteErrors
• WriteErrors
• Non-Read/WriteRequests
• WriteI/ORequests
• StatisticsCollectionTime
 Loading...