Chapter 7 Monitoring M E T E R S Viewing R E A L - T I M E W A V E F O R M S
120 PM130 PLUS Powermeter Series
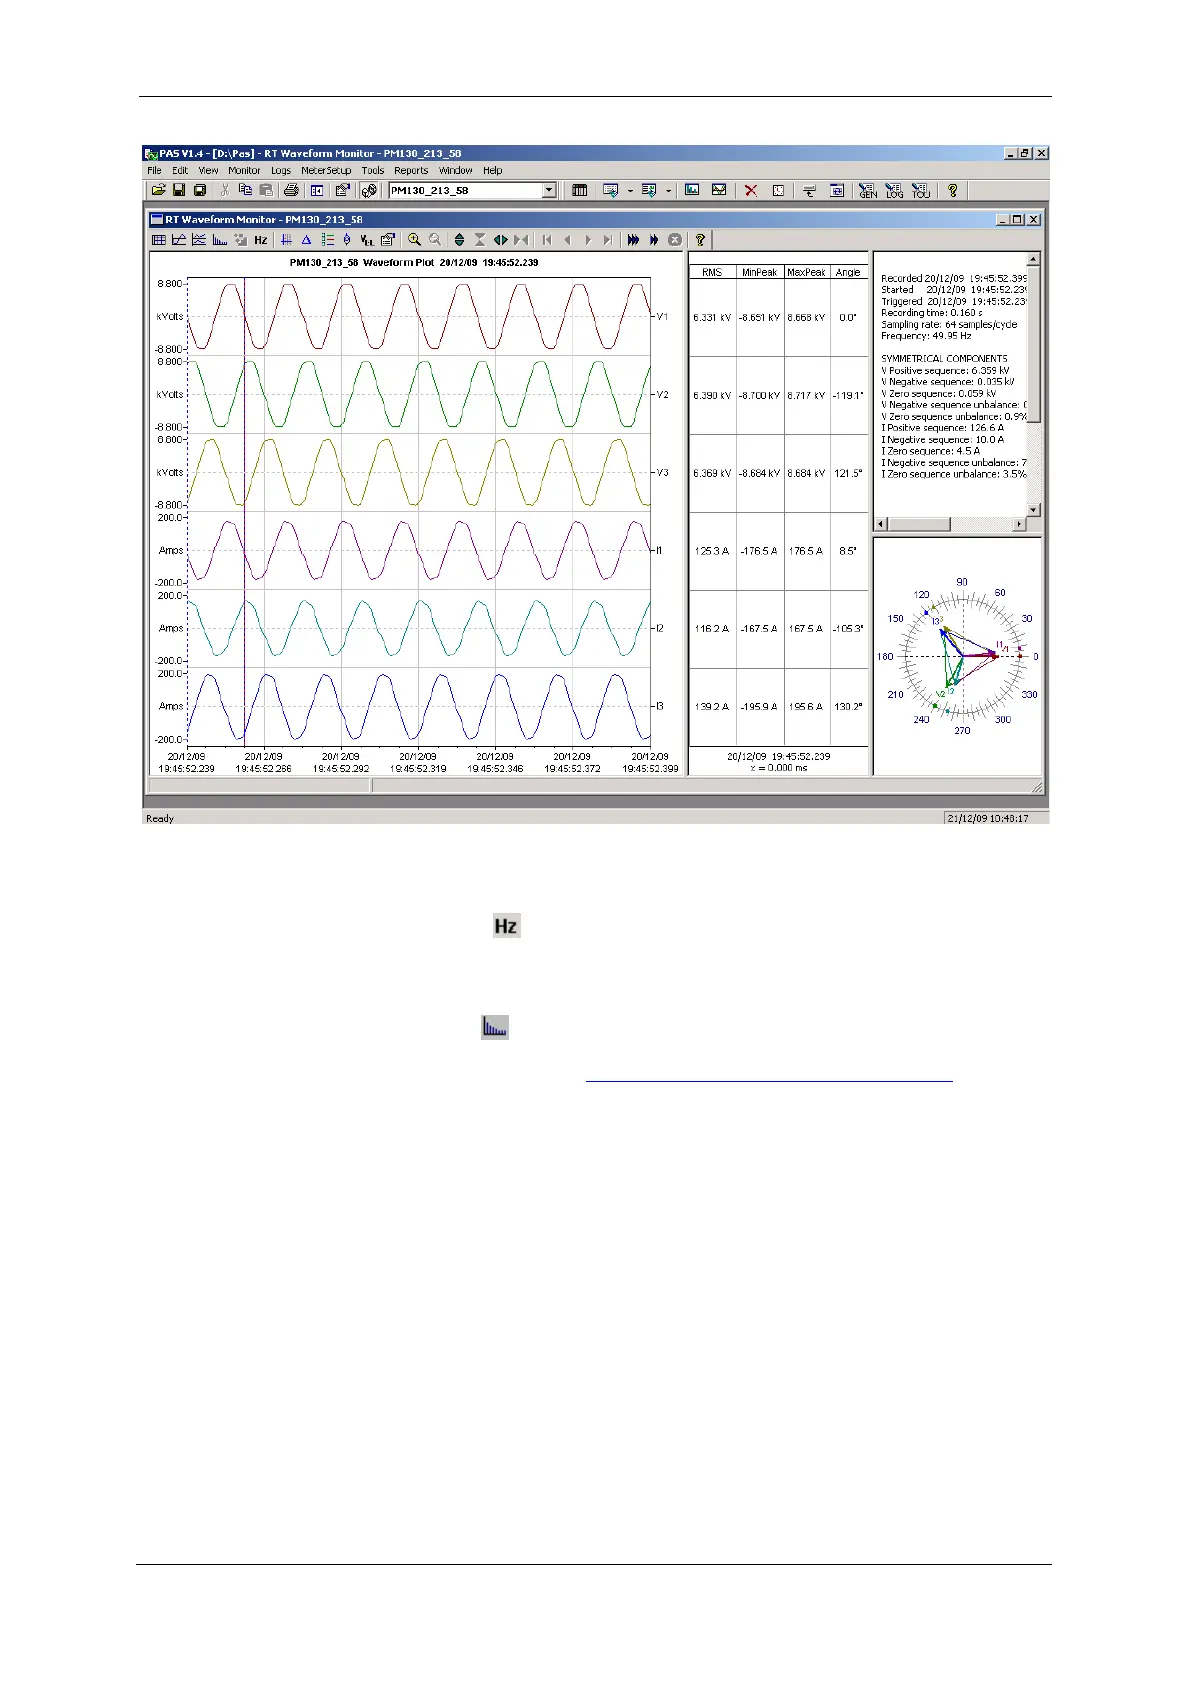
Figure 7-2: RT Waveform Monitor Window
Viewing a Frequency Plot
Click on the
button to view a cycle-by-cycle frequency plot for the
sampled voltage waveforms.
Viewing a Harmonic Spectrum
Click on the
button to view a spectrum chart for the selected waveform
channel. PAS provides voltage, current, active power and reactive power
spectrum charts. See Viewing Real-time Harmonic Spectrum for more
information on viewing options.
Viewing Phasor Diagrams
The phasor diagrams show you relative magnitudes and angles of the
three-phase voltage and current fundamental component. All angles are
shown relative to the reference voltage channel.
To change the reference channel, click on the waveform window with the
right mouse button, select Options..., click on the Phasor tab, check the
channel you want to make a reference channel, and then click OK.
Viewing Symmetrical Components
Waveform views have an additional pane at the right where PAS displays
the symmetrical components for voltages and currents, calculated for the
point indicated by the left marker line.
To enable or disable the symmetrical components, click on the waveform
window with the right mouse button, select Options..., check or uncheck