13
4.03 TRIP LOG Page
(GPS Map → MAIN MENU → COMPASS →
TRIP LOG)
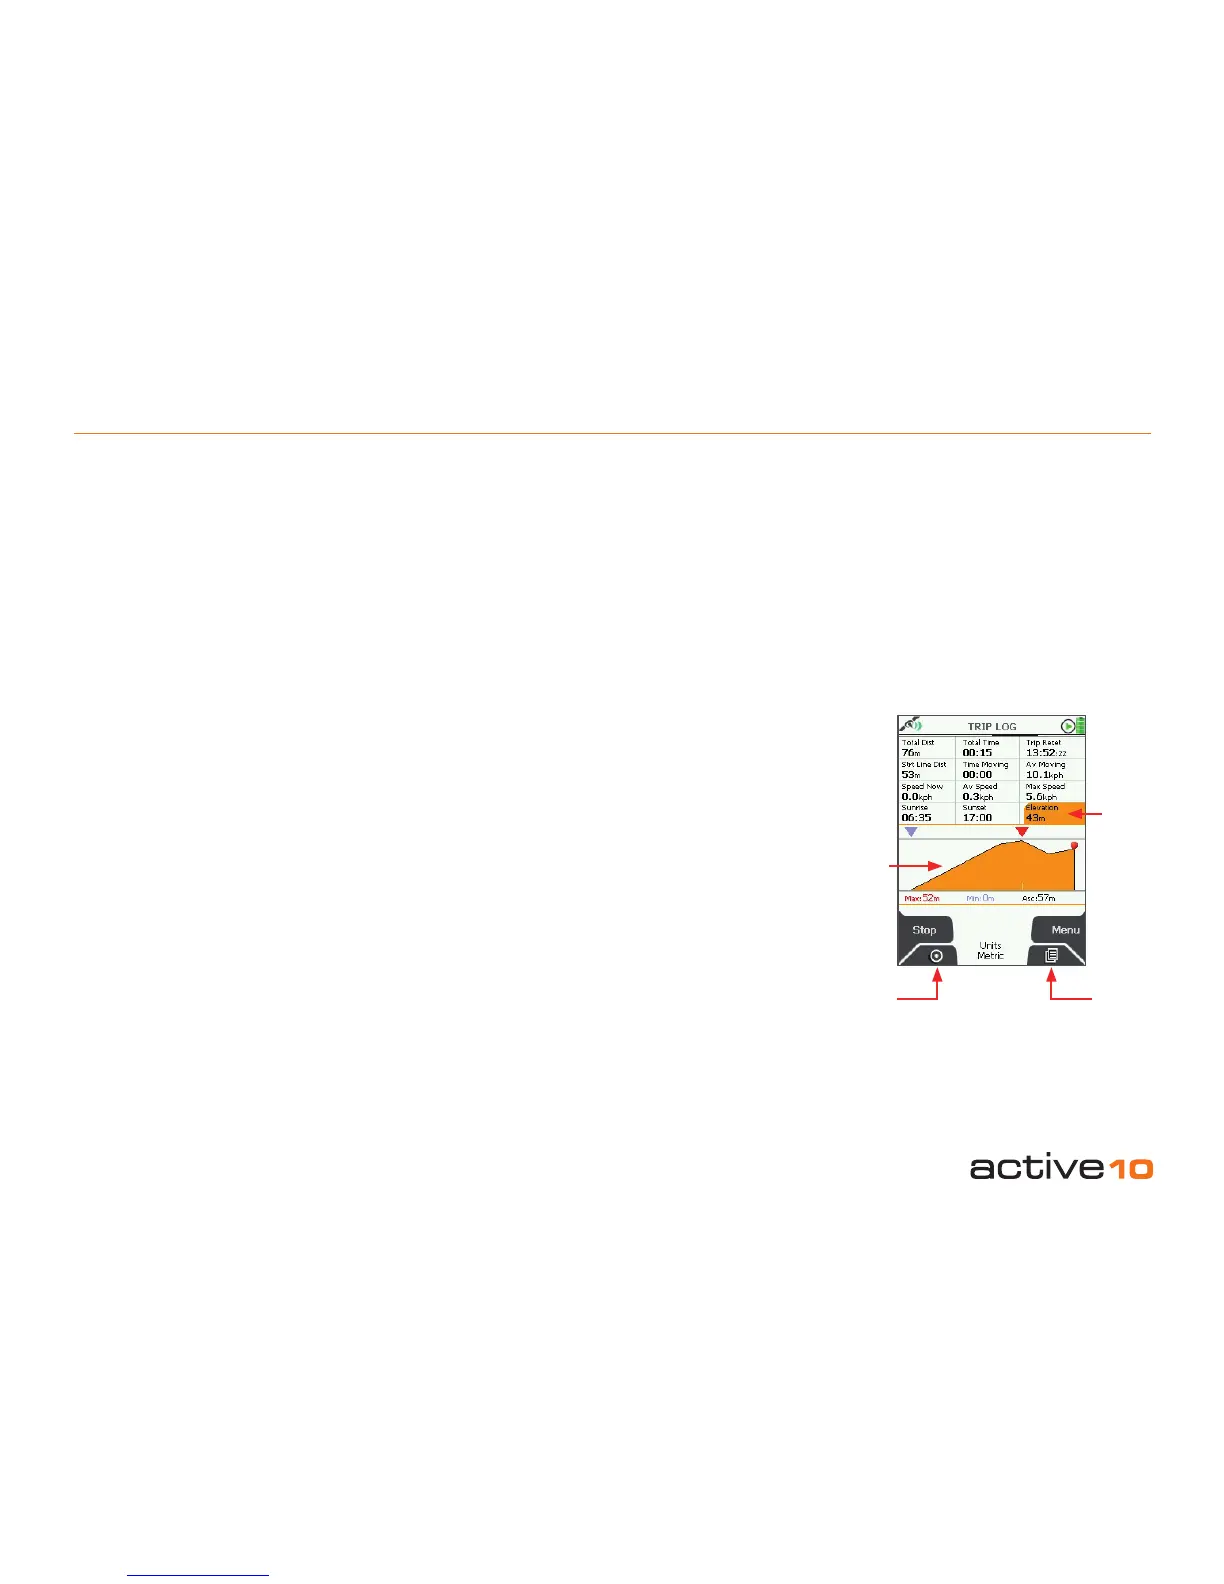
The upper half of the TRIP LOG page is split
into 12 data elds:
• Total distance travelled
• Total time
• Trip reset (time of last reset)
• Straight Line Distance
• Time Moving
• Average Moving Speed
• Speed Now
• Average Speed
• Maximum Speed
• Sunrise Time
• Sunset Time
• Elevation (altitude above sea level)
All units can be given in metric or imperial.
(section 5.09).
The lower half of the TRIP LOG page graphs
an elevation prole of your journey. Above
the graph, a red pointer indicates maximum
height and a blue pointer indicates minimum
height. Below the graph, the gures for
these heights are given. Also shown is the
abbreviation ‘Asc:’ for ascended height.
Buttons:
Start/Stop
Press to start/stop logging data.
(Note: remember that if say, Stop is showing,
it means Start was the button pressed
previously).
The unit’s data logging functions are intended
to register a single trip. The log should be
reset before starting the next trip. Using the
Start/Stop button allows you to pause data
logging during a journey, eg. pausing for a
lunch break.
When Stop has been pressed, the unit stops
all data logging. If you switch to the GPS Map
screen and continue moving, no snail trail is
left.
Lock to GPS
Return to last map screen
Page
Go to GPS STATUS page (section 4.04)
Menu
Access the following range of options:
• Reset All
• Reset All & Convert
• Reset Log (keeps snail trail and elevation
prole)
• Reset Trail (also resets elevation data)
• Reset Trail & Convert
• Convert Trail to Track (section 4.04)
• Set Trip Data (section 5.12)
There are on-screen descriptors for each
option.
Note: If you transit between trips and press
Start without resetting the log, the transit
is shown as a straight line snail trail to your
present location and will be incorporated into
subsequent data logging.
4.03 TRIP LOG
Figure 4.03
Lock to
GPS
Page
Elevation data (section 5.07):
• Elevation data is provided by Ordnance
Survey. This is from a gridded height data
set, with 200 ft between each point on the
elevation prole (gure 4.03). Spot heights
above sea level are given at intersections
and any given location is given a weighted
average of the 4 surrounding spot heights.
• GPS elevation data. GPS is less accurate
when giving elevation data and errors of ±
50m may be encountered.
Elevation
data
Elevation
prole