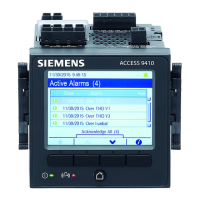
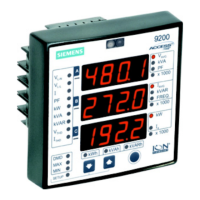
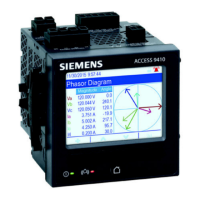
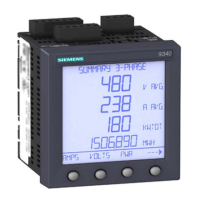
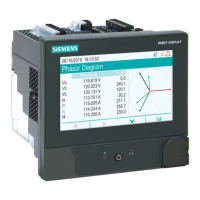
Measurements 9410 series
kW sd del-rec (demand) Freq (frequency)
Vll ab I a mean
Vll bc I b mean
Vll ca I c mean
Vll avg I avg mean
You can configure the start day of the week for trending and forecasting using ION
Setup.
Viewing trending and forecasting data on your meter’s webpages
You can select data for forecasting and trending and view the resulting information
using your meter’s webpages.
For trending and forecasting to operate, your meter must have accumulated data for at
least two of the specified intervals; for example, if you want to view a daily graph, your
meter must have accumulated data for at least two previous days before the present
day.
1. Log in to your meter’s webpages
2. Click Monitoring > Trending & Forecasting
3. Select the Target and Interval. The graph for the selected data is displayed.
7EN05-0336-03 175
 Loading...
