78 | Instruments
Blank page
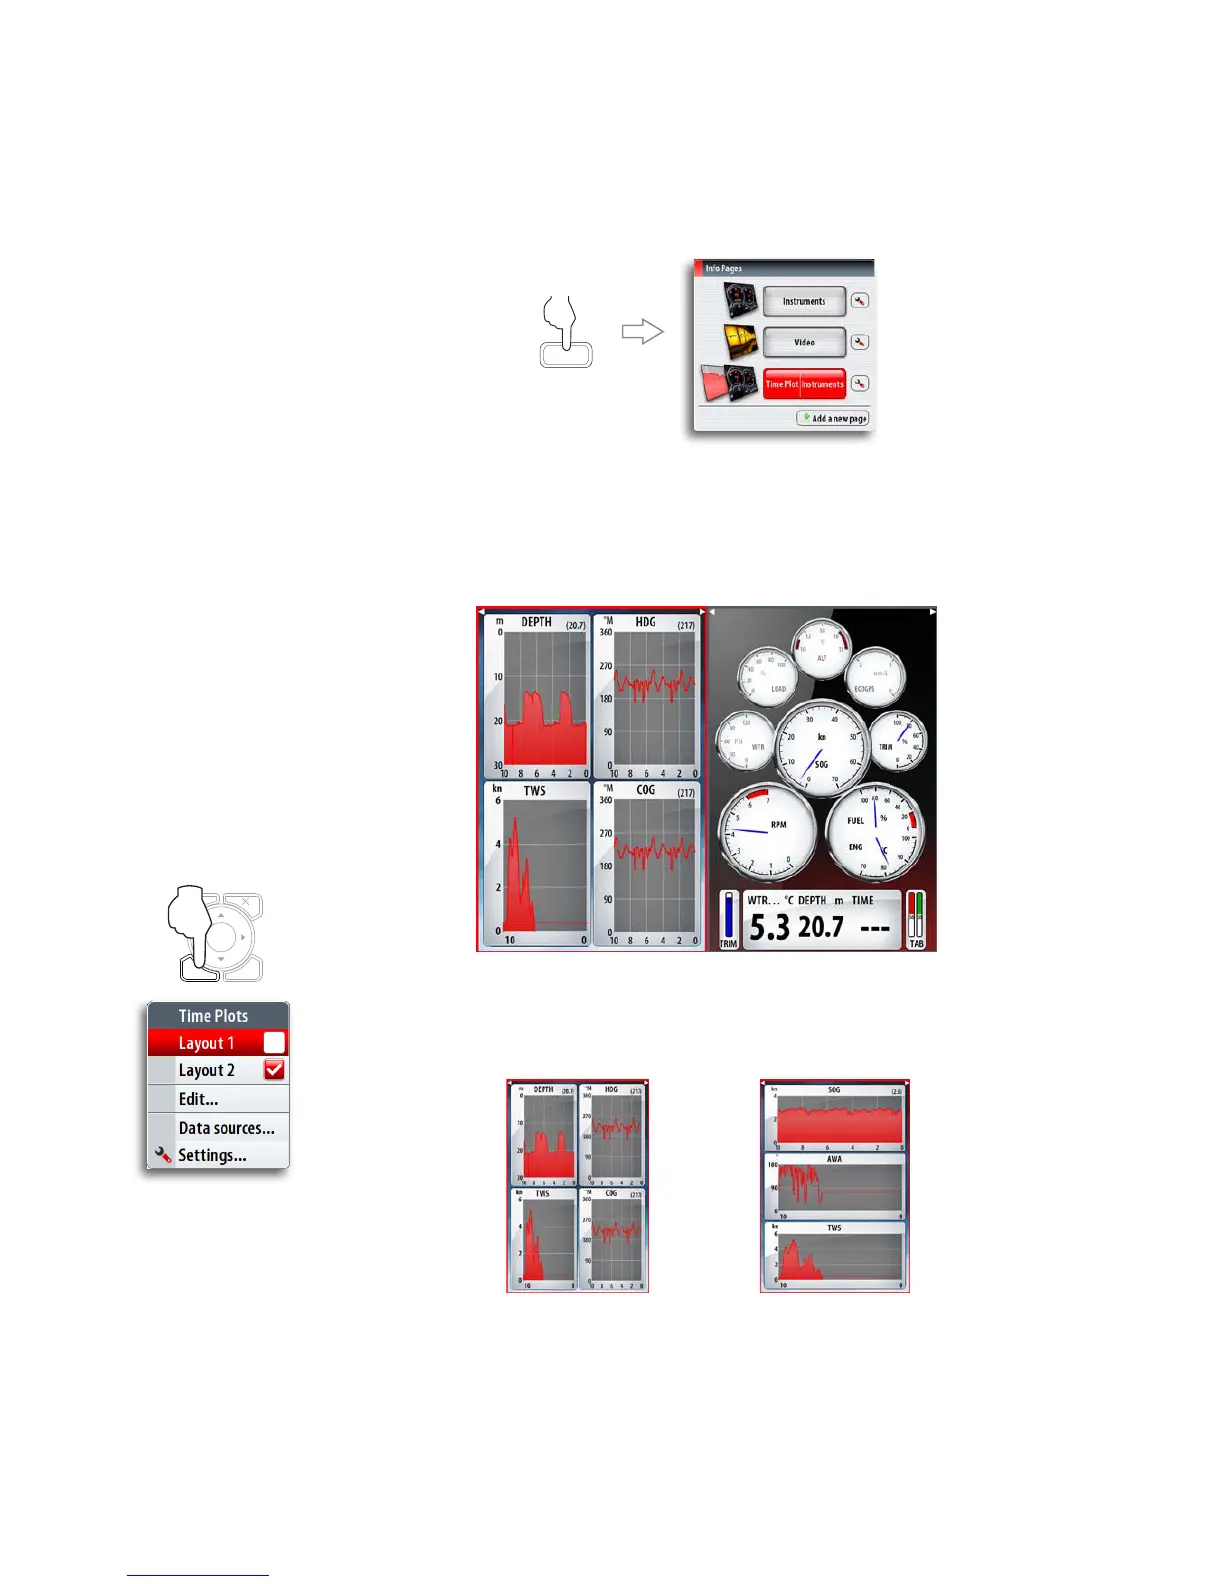
Info Panel
Time Plots
the vessel.
INFO
The system can present data history in different plots, and data selection can be defined
by the user.
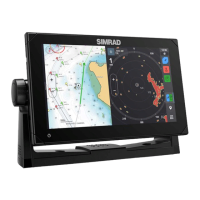
The plots can be set up as single panel layouts, or combined in one panel as shown
below.
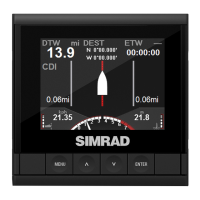
The Time plot panel consists of two predefined layouts. You switch between the layouts
by using the left and right arrow keys or by selecting the dashboard from the menu
when the Time plot panel is active.
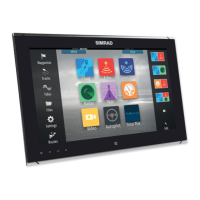
Layout 1, 4 data sets Layout 2, 3 data sets
Missing Data
If instrument data is unavailable, the time plot will turn into a dashed line and flatten out
at the point data was lost. When data becomes available again a dashed line will join up
the two points showing an average trend line bridging the missing data.
MENU WIN