6. Operating the infinite® 200
112 Instructions for Use for infinite® 200 No. 30017581 Rev. No. 1.4 2008-07
6.6.4 Result Display in MS Excel
®
The MS Excel
®
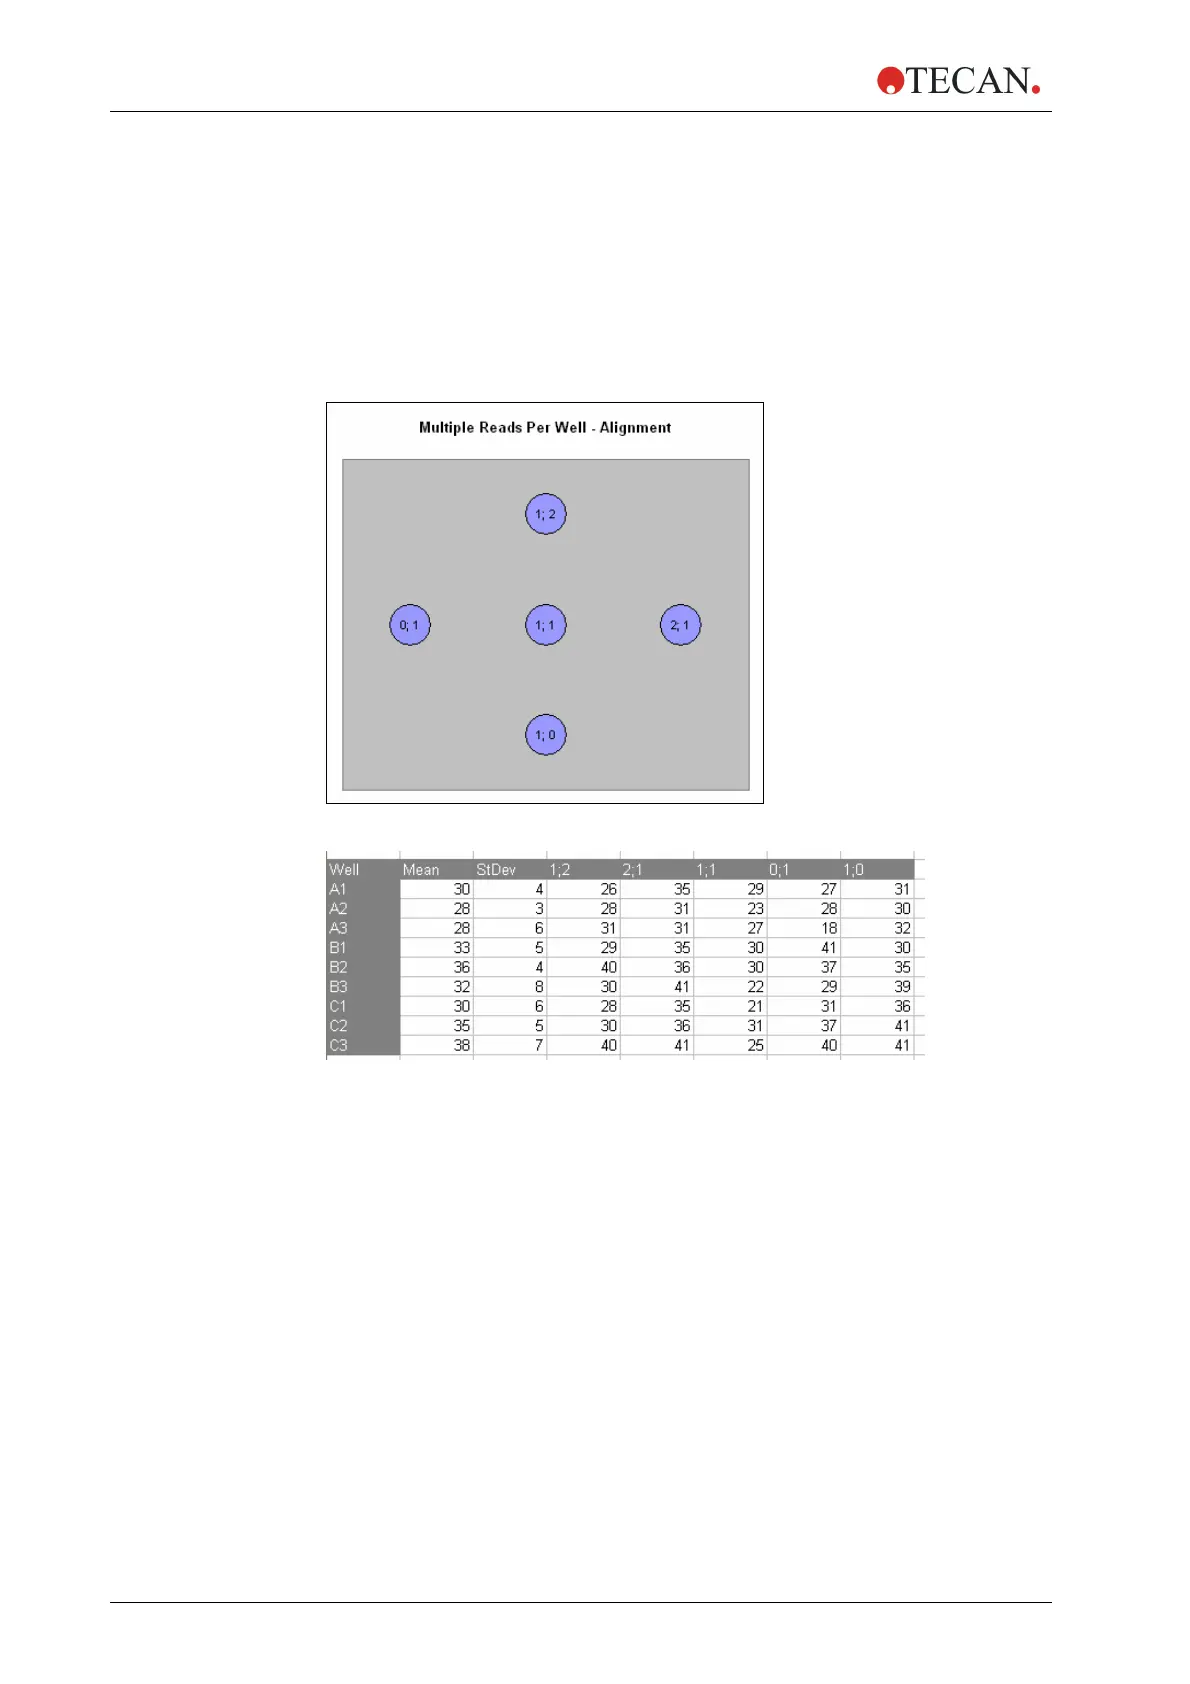
result sheet generated by the i-Control software displays a
schematic graphical overview (‘Multiple Reads Per Well – Alignment’; see Figure
6-2
) of the measurement points. A number is assigned to each measurement
point. The results are presented in list form: number of measurement point versus
result value (OD or RFU; see Figure 6-3 for result of a fluorescence
mea
surement). In addition, the standard deviation (‘Stdev’) and the average value
(‘Mean’) of the measurements points/well are also displayed:
Figure 6-2: Alignment graphic (XY-Line, 3 x 3)
Figure 6-3: Example of MS Excel
®
result list generated by i-Control.
6.6.5 Miscellaneous Software Features of MRW
MRW is only available for the measurement modes ‘Absorbance’, ‘Fluorescence
Intensity Top’ and ‘Fluorescence Intensity Bottom’.
The MRW feature is not active when performing well-wise measurements.
‘Reference Wavelength’ (located on the absorbance strip) is not available in
combination with ‘Multiple Reads Per Well’.