Understanding Oscilloscope Functions
If the signal yo
u are viewing is also the trigger source, use the graticule or the
cursors to estimate the frequency of the displayed waveform. Compare this to
the Trigger Frequency readout in the lower right corner of the screen. If they
differ by a large amount, you may have aliasing.
Taking Measurements
The oscilloscope displays graphs of voltage versus time and can help you to
measure the displayed waveform.
There are several ways to take mea surements. You can use the gratic ule, the
cursors, or an automated measurement.
Graticule
This method allows you to make a quick, visual estimate. For example, you might
look at a waveform amplitude and determine that it is a little more than 100 mV.
You can take simpl
e measurements by counting the major and minor graticule
divisions involved and multiplying by the scale factor.
Forexample,ifyoucountedfive major vertical graticule divisions between the
minimum and maximum values of a waveform and knew you had a scale factor of
100 mV/division, then you could calculate your peak-to-peak voltage as follows:
5 divisions x 100 mV/division = 500 mV
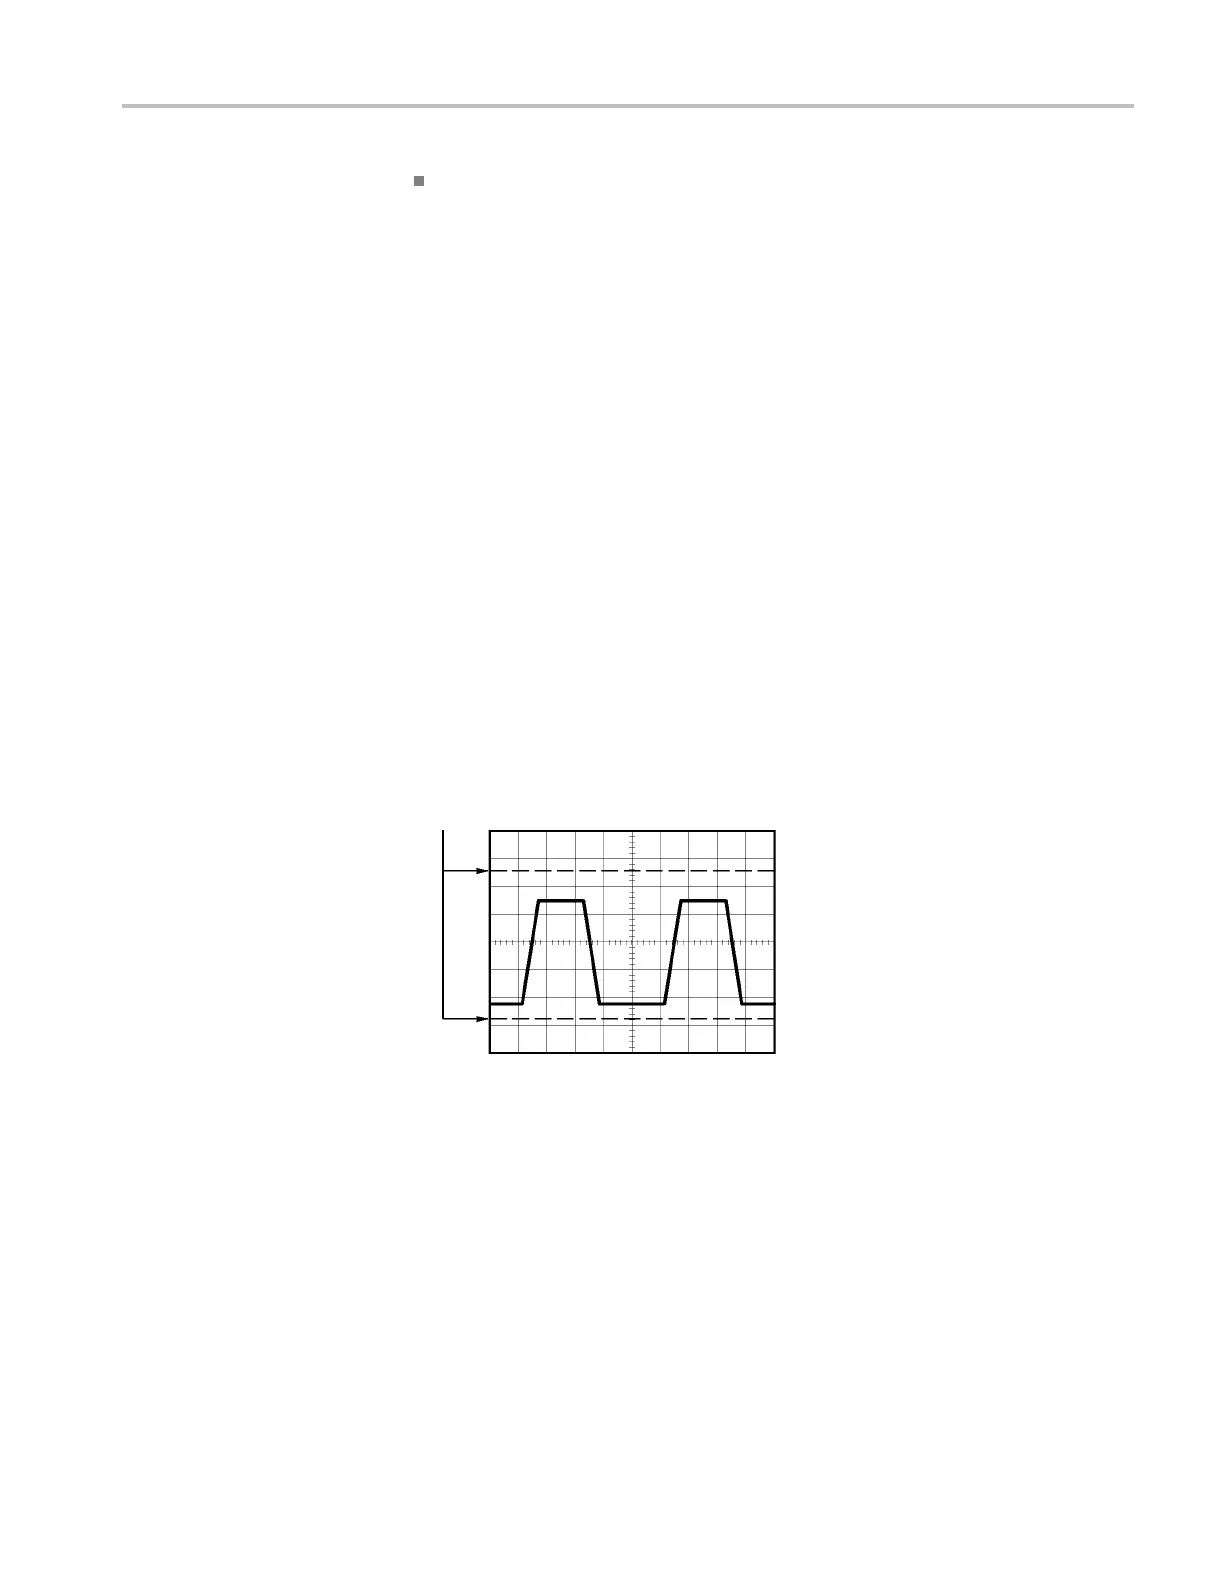
Cursor
Cursors
This method allows you to take measurements by moving the cursors, which
always appear in pairs, and reading their numeric values from the display readouts.
There are two types of cursors: Amplitude and Time.
When you us e cursors, be sure to set Source to the waveform on the display that
you want to measure.
You can use the cursors to define the measurement gating area, after you have
turned on Measure Gating in the Measure menu. The oscilloscope will restrict
the ga ted mea surement you take to the data between the two cursors.
To use cursors, push the Cursor button.
TBS1000B and TBS1000B-EDU Series Oscilloscopes User Manual 23
 Loading...