Reference
Trend Plot (no
n-EDU models only)
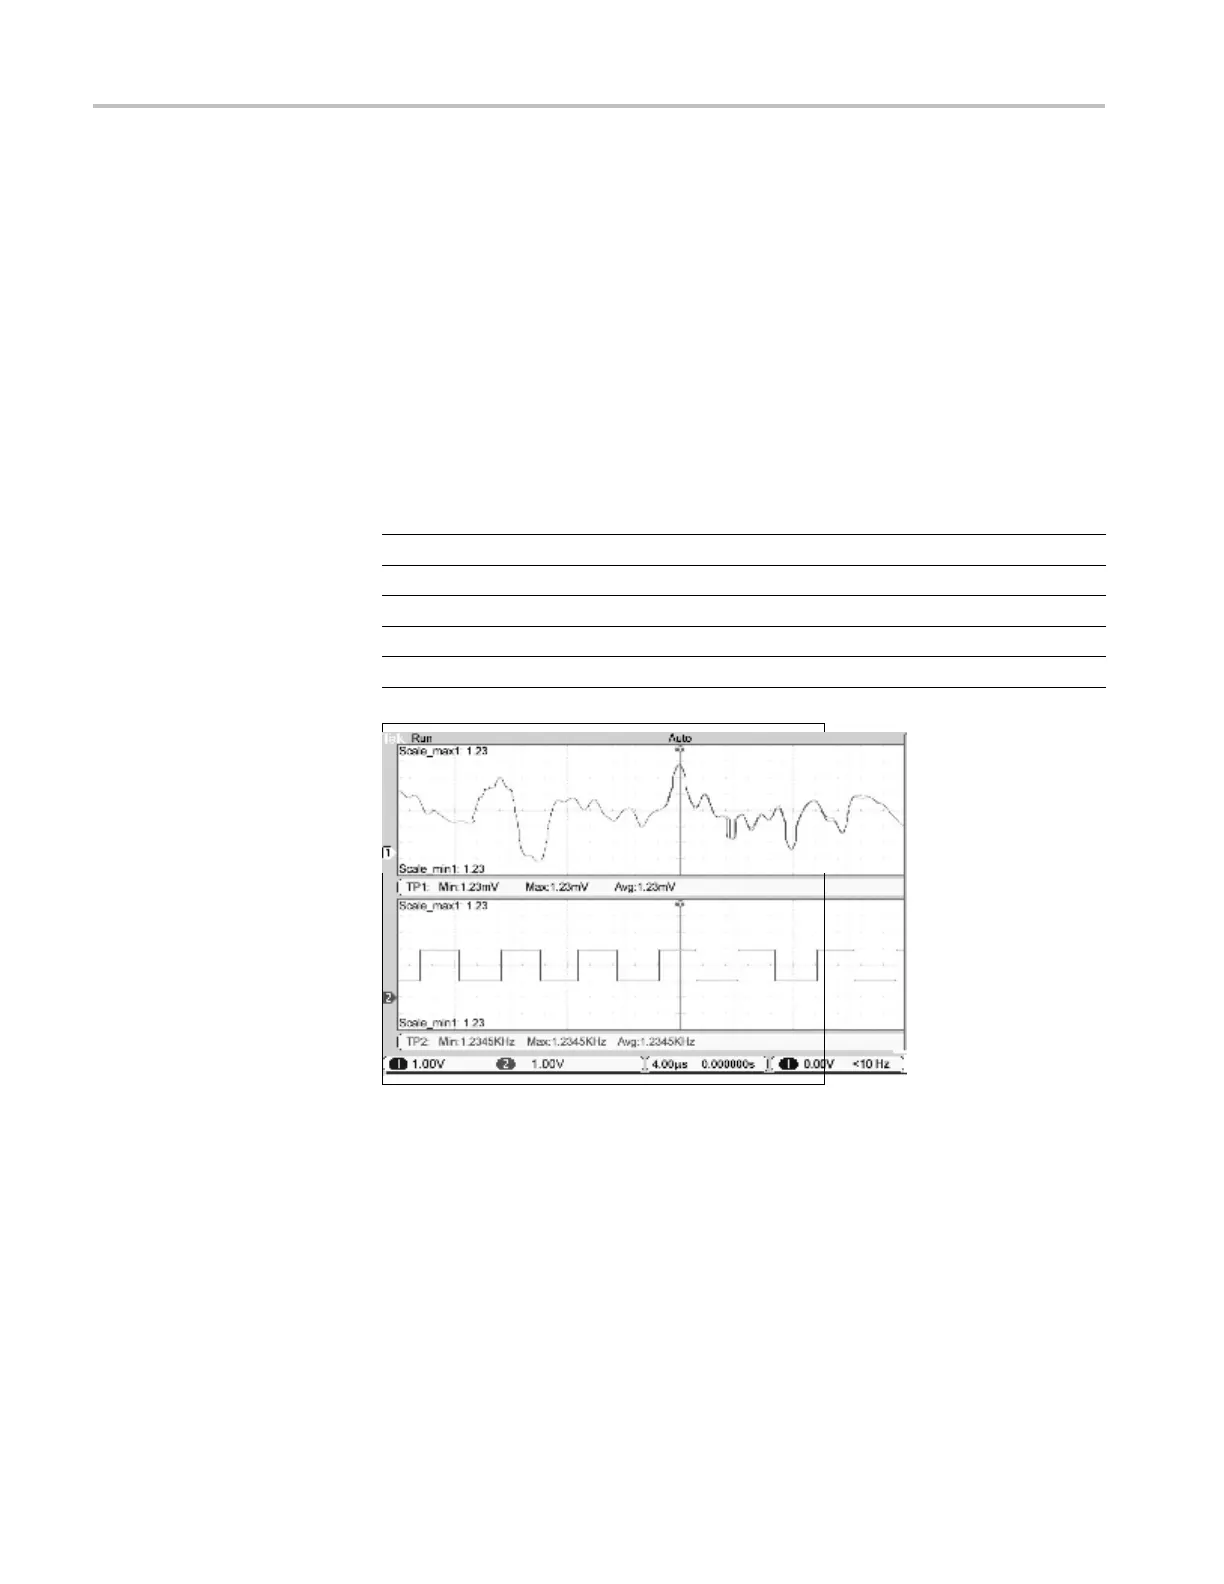
The trend function plots a graph of measurements as a function of time. You can
display up to two trend plots simultaneously.
The TrendPlot™ function helps find intermittent faults. To run, select the type
of measurements to capture from either or both channels and then set up the
oscillosco
pe to continuously monitor the signals, plot the data onto the display
and simultaneously save the information to a USB memory device. You’ll be able
to capture data for minutes , hours or days. Just evaluate your requirement and the
size of your USB memory device and then adjust your oscilloscope settings.
To operate:
Options Settings Comments
Run, Sto
p
Run, Sto
p
Source
1
Ch1, Ch
2
Type 1 Minimum, m aximum
Source 2 Ch1, Ch2
Type 2 Minimum, m aximum
Trigger C ontrols
You c an define the trigger through the Trigge r Menu and front-panel controls.
Trigger Types
Three types of triggering are available: Edge, Video, and Pulse Width. A different
set of options display for each type of trigger.
96 TBS1000B and TBS1000B-EDU Series Oscilloscopes User Manual
 Loading...