Display a Wavefo
rm
Spectral Grading displays areas of
the w aveform with the highest sample
density in blu
e shades. The areas of
lowest sample density appear in red
shades.
User displays the waveform in a
customized c
olor that you define by hue,
lightness, and saturation.
Quick Tips
Choose one of the color grading palettes in the Display>Colors control window to see different sample densities
represented in different colors.
There are two color palettes, one for Record View and one for W fmDB.
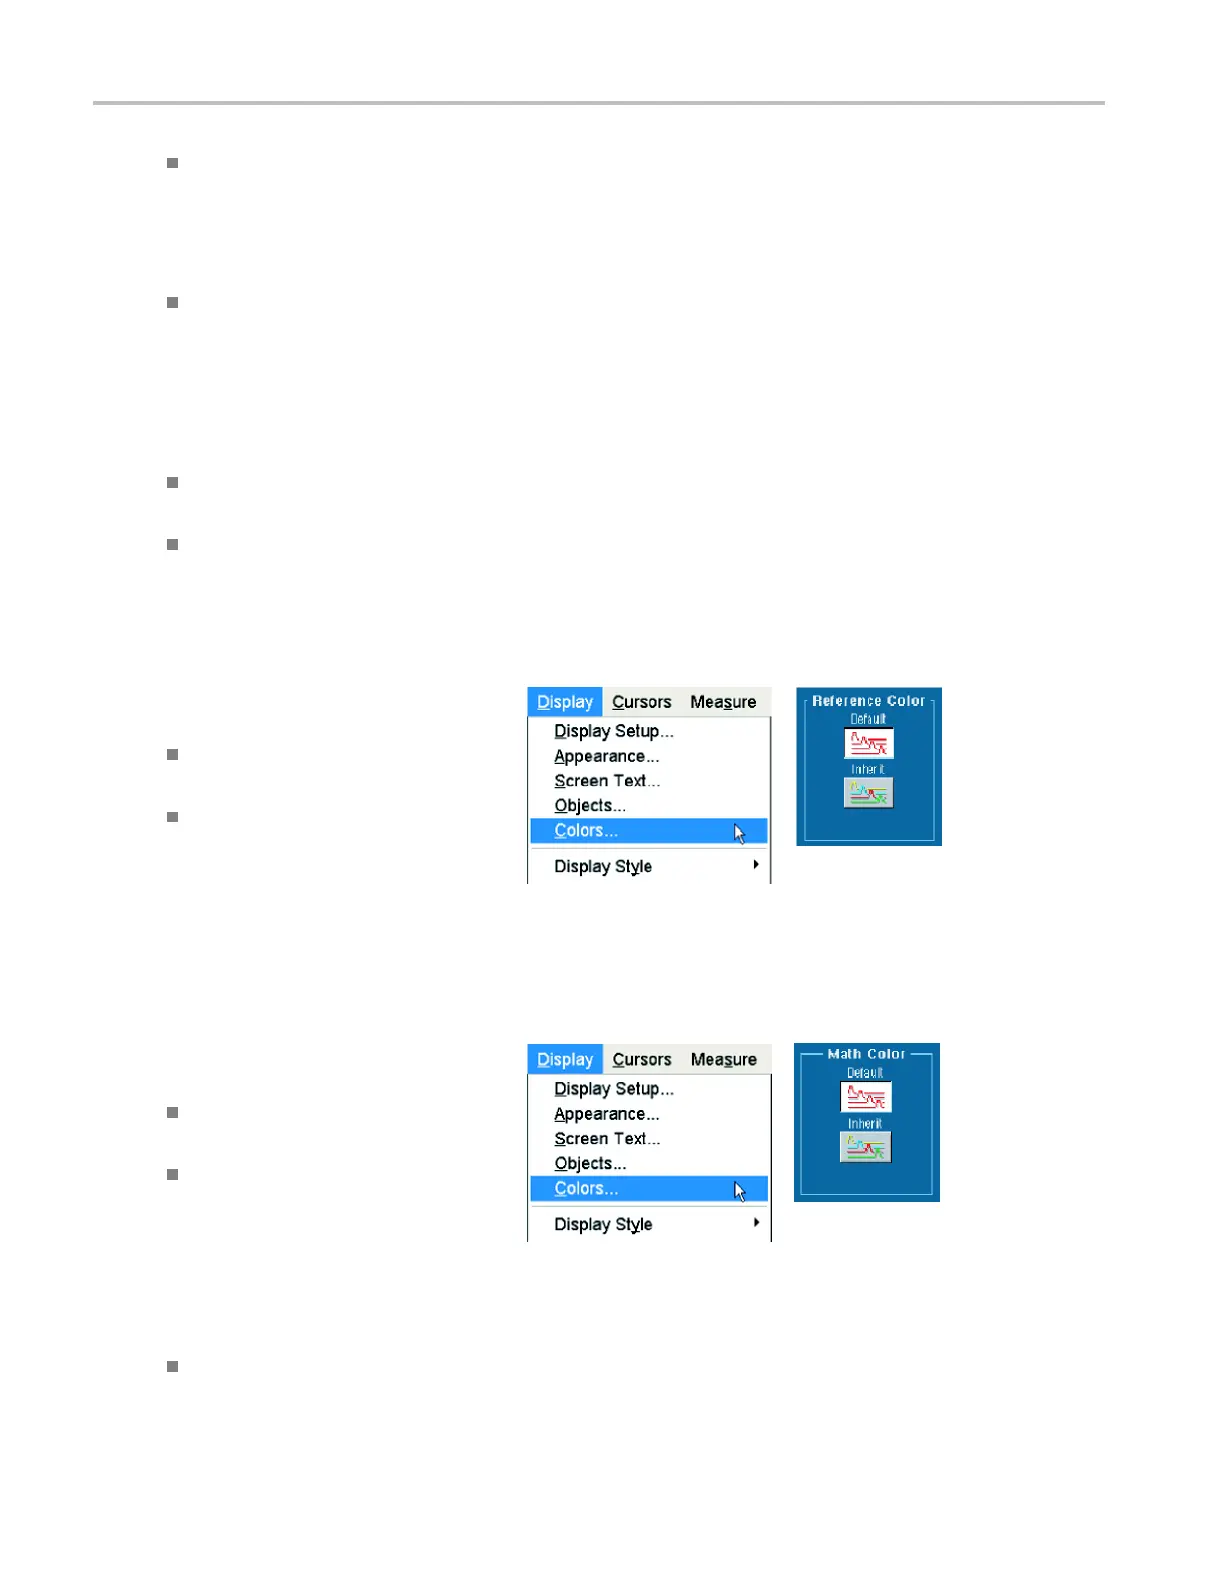
Setting the Reference Colors
Select Display > Colors... and then select
one of the following:
Default uses the default system color for
reference waveforms.
Inherit uses the same color for the
reference waveform as the original
waveform.
Setting Math Colors
Select Display > Colors... and then select
one of the following:
Default uses the default system color for
math waveforms.
Inherit uses the same color for the math
waveform as the w aveform the math
function is based on.
Quick Tips
The default color for math and reference waveforms are different for each wav
eform.
42 TDS6000B & TDS6000C Series Quick Start User Manual
 Loading...