5-7
Running a Case
Multi-Graphs (Optional)Multi-Graphs (Optional)
Tap the Multi-Graph menu to view precongured, multi-parameter graphs. Up to four
multi-graphs can be arranged to view simultaneously.
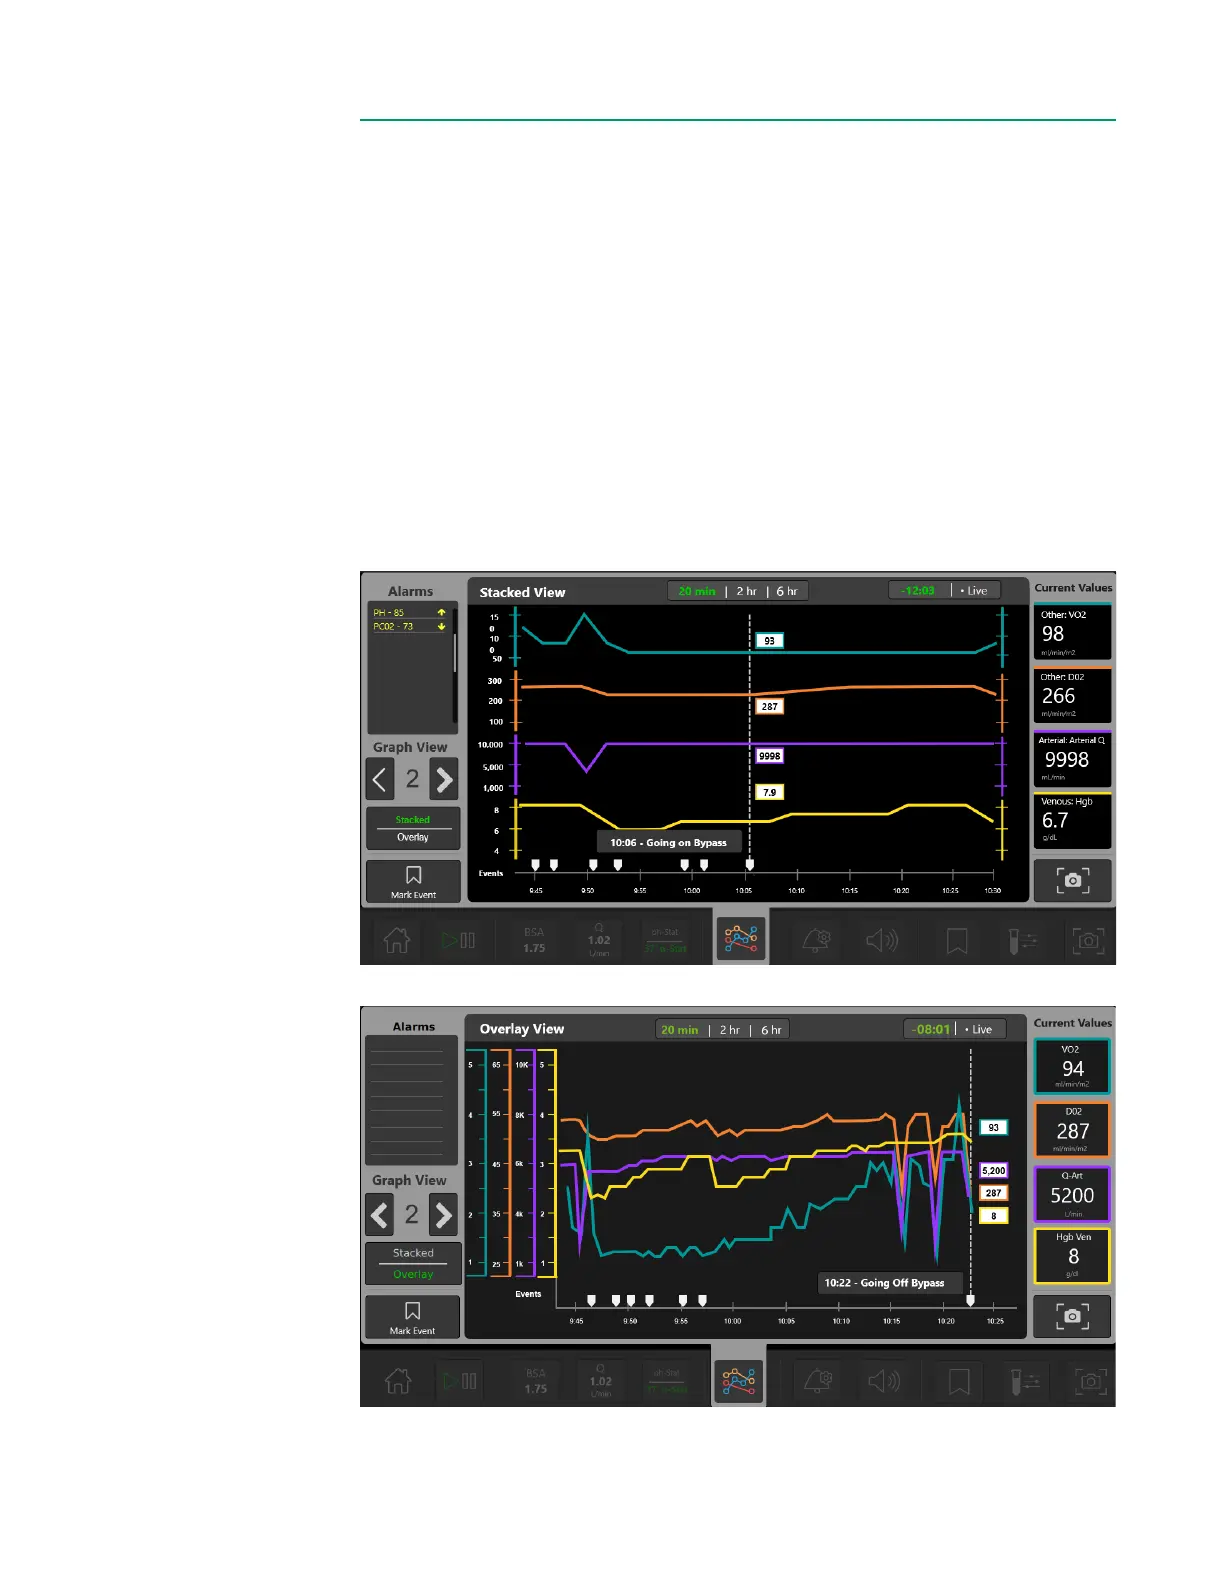
• Multi-graphs can be shown as either Stacked or Overlay graphs. See the images
below for examples.
• Toggle through the user-dened graph views by tapping the arrows on the left.
• The current parameters’ values are shown on the right. All active alerts/alarms are
shown on the left.
• Tap the top of the graph to toggle between time ranges of 20 minutes, 2 hours,
and 6 hours of data for that parameter.
• Press, hold and drag anywhere on the graph to view previous data.
• The upper right shows either the time offset (in minutes : seconds) or Live
highlighted in green. If the graph is displaying current data for the parameter, then
Live will be highlighted in green. If the graph is at an offset, Live can be tapped to
return to displaying current data.
Stacked View
Overlay View