AU-OPR-AureFloFT-EN,
Rev H
39
Appendix C: ECG Signal, D/S Ratio & DF
DESCRIPTION
This appendix describes the display and analysis of the ECG signals with Transonic
®
FlowTrace
®
software.
When a “standard” ECG signal is displayed on the touch-panel display, FlowTrace
®
calculates and displays
Diastolic/Systolic Flow Ratio (Fig. C.1):
D/S Ratio =
Average Diastolic Volume Flow
Average Systolic Volume Flow
DIASTOLIC FRACTION (DF)
FlowTrace
®
offers the option of displaying the diastolic fraction (DF) instead of the D/S Ratio. The DF option
is found in the System Settings menu. See page 16 for instructions. The diastolic fraction is the percent of
diastolic volume ow compared to total (systolic plus diastolic) volume ow.
DF =
Diastolic Volume Flow
x100
Diastolic Volume Flow + Systolic Volume Flow
● A DF% >50% indicates a diastolic-dominant ow prole.
● A DF% approximating 50% indicates a balanced, diastolic-systolic, ow prole.
● A DF% <50% indicates a systolic dominant ow prole.
Transonic
®
recommends using the D/S Ratio instead of the DF for most situations. Use of the D/S Ratio will
make it easier for the CABG surgeon to follow the Transonic
®
proven coronary graft patency assessment.
Beating Heart Graft Patency assessment follows a straightforward decision tree:
1) ASSESS MEAN FLOW READING OF THE FLOWMETER
● Mean ow < 5 mL/min always indicates a technical error
● Mean ow >25 mL/min (or >20 mL/min on a small patient) indicates a well-functioning graft.
● If mean ow is inconclusive: between 5 and 25 (20) mL/min, Flow Waveform Assessment is
necessary.
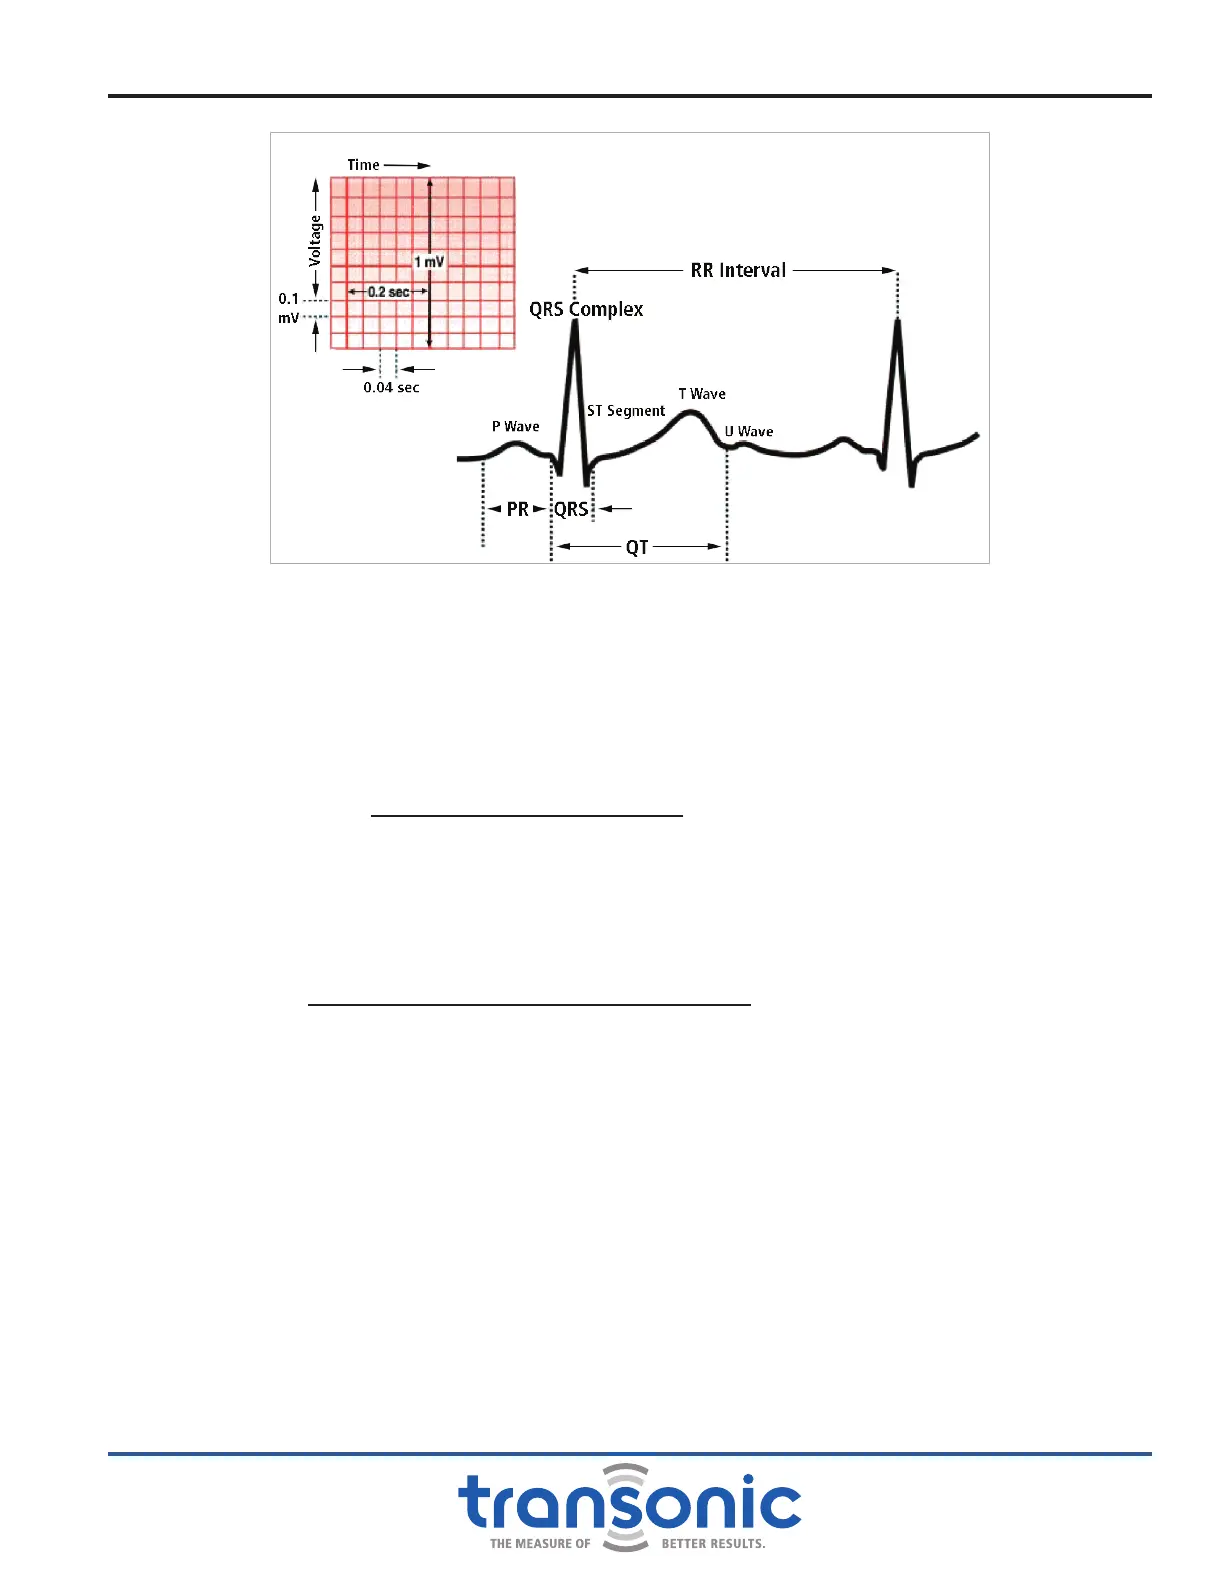
Fig. C.1: ECG signal that will be recognized by FlowTrace
®
software. The R-peak of the QRS
complex is the highest peak of the signal; this is when the systolic contraction starts
to affect the ow waveform. The peak of the T-wave is the point where diastolic
relaxation starts to affect coronary ow. This is typically 200 msec after the R-peak.