10-49
IM 701310-01E
Analysis and Search
3
2
1
4
5
6
7
8
9
10
11
12
13
14
15
16
17
18
19
App
Index
Displaying a Trend
Selecting the Displayed Items
4.
Select the displayed items according to steps 4 to 9 on page 10-46 and 10-47.
Turning the T-Y Waveform Display ON and OFF and Setting the Display
Range
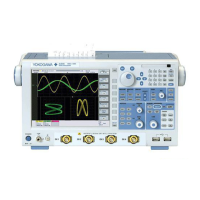
5.
Press the Display Setup soft key.
6.
Press the VT soft key to select ON or OFF.
7.
Press the Auto Scale EXEC soft key to automatically set the display range.
Upper/Lower and H Span menu items are updated with the automatically set values.
8.
Press the Upper/Lower soft key.
9.
Use the rotary knob to set the upper and lower limits.
Press the soft key to select the limit that you want to set using the rotary knob.
10.
Press the H Span soft key.
11.
Use the rotary knob to set the number of displayed horizontal points.
12.
Press ESC.
Upper
Lower
When the waveform parameter mode is
one of the modes in the table below, the
H Span soft key changes to ◄ H Range
soft key. Carry out the following steps.
• Press the ◄ H Range soft key.
• Press a soft key from Main to Zoom2
to select the waveform area.
Mode
Cycle Statistics
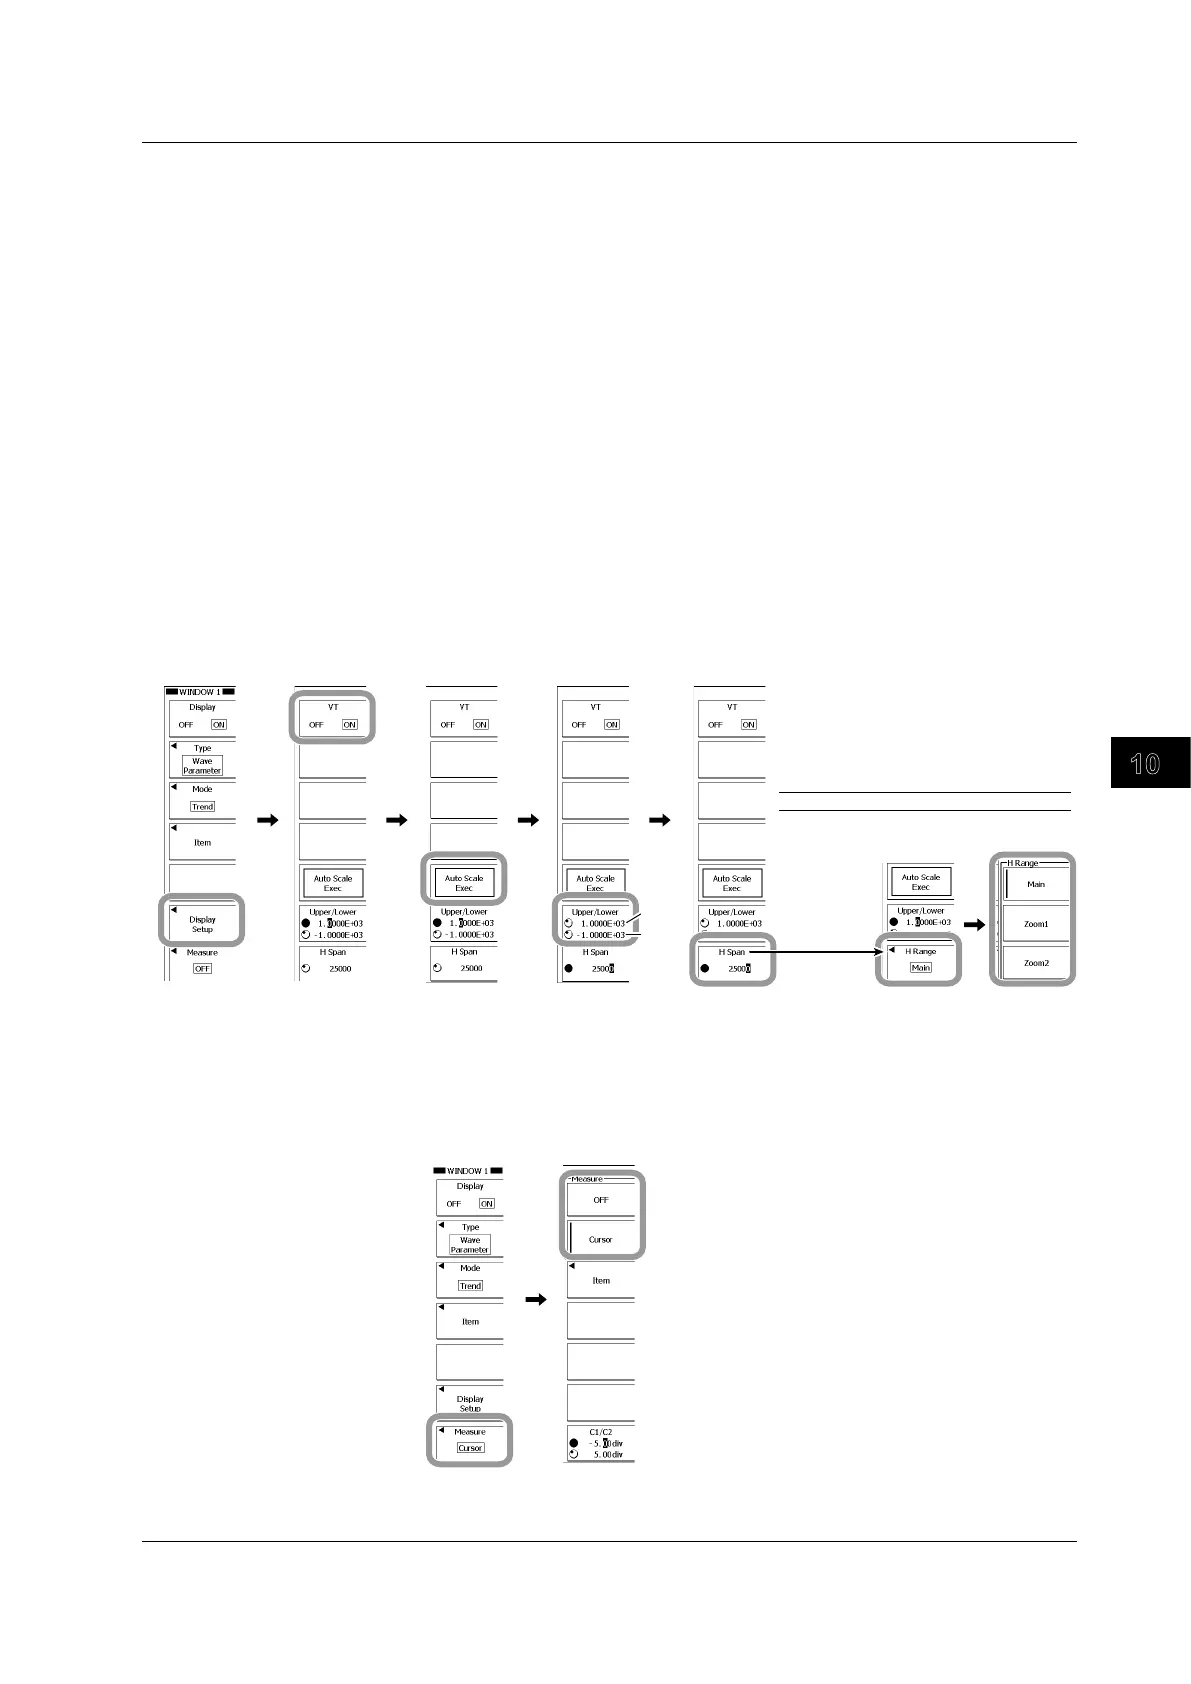
Analyzing by Using Cursors
13.
Press the Measure soft key.
14.
Press the OFF or Cursor soft key to select the analysis function.
If you select OFF, you are done with the settings.
If you select Cursor, proceed to step 15.
15.
Perform analysis using cursors according to steps 15 to 19 on page 10-48.
10.8 Displaying a Histogram, Trend, or List of the Automatically Measured Waveform Parameters
 Loading...