38
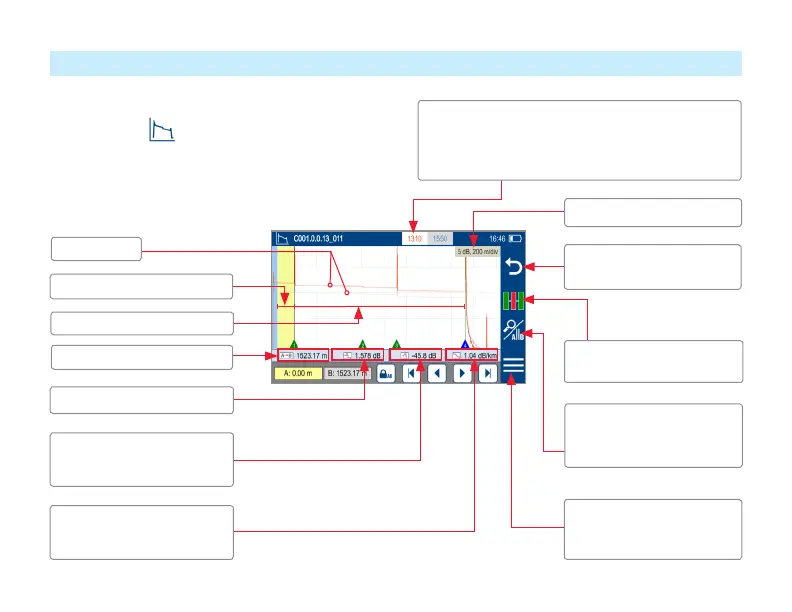
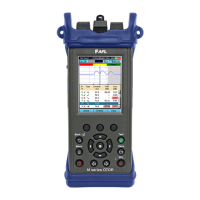
Understanding Trace View Features
Touch to display Menu
function (Save As, Print to
PDF, etc.)
Loss between A and B cursor
Loss-per-distance between A
and B cursors
Maximum Reectance
between A and B cursor
OTDR traces
Launch cable (if present)
Fiber under test
Distance from A to B cursor
Touch to toggle between
Zoom and A|B Cursor
Control modes
Touch to switch to the
LinkMap view
Touch to return to the
previous screen
Trace View is accessed from any other results view
by touching the Trace tab. Trace View displays
OTDR trace(s), graph scale (dB/div & m/div), A/B cursor
locations, A-to-B cursor distance, loss, reectance and
loss/distance measurements.
Graph scale (dB/div & m/div)
• Touch the desired wavelength make it active.
• White background indicates active wavelength.
• Cursor measurements apply to active wavelength.