Balance System SD (with v4.X software) 131
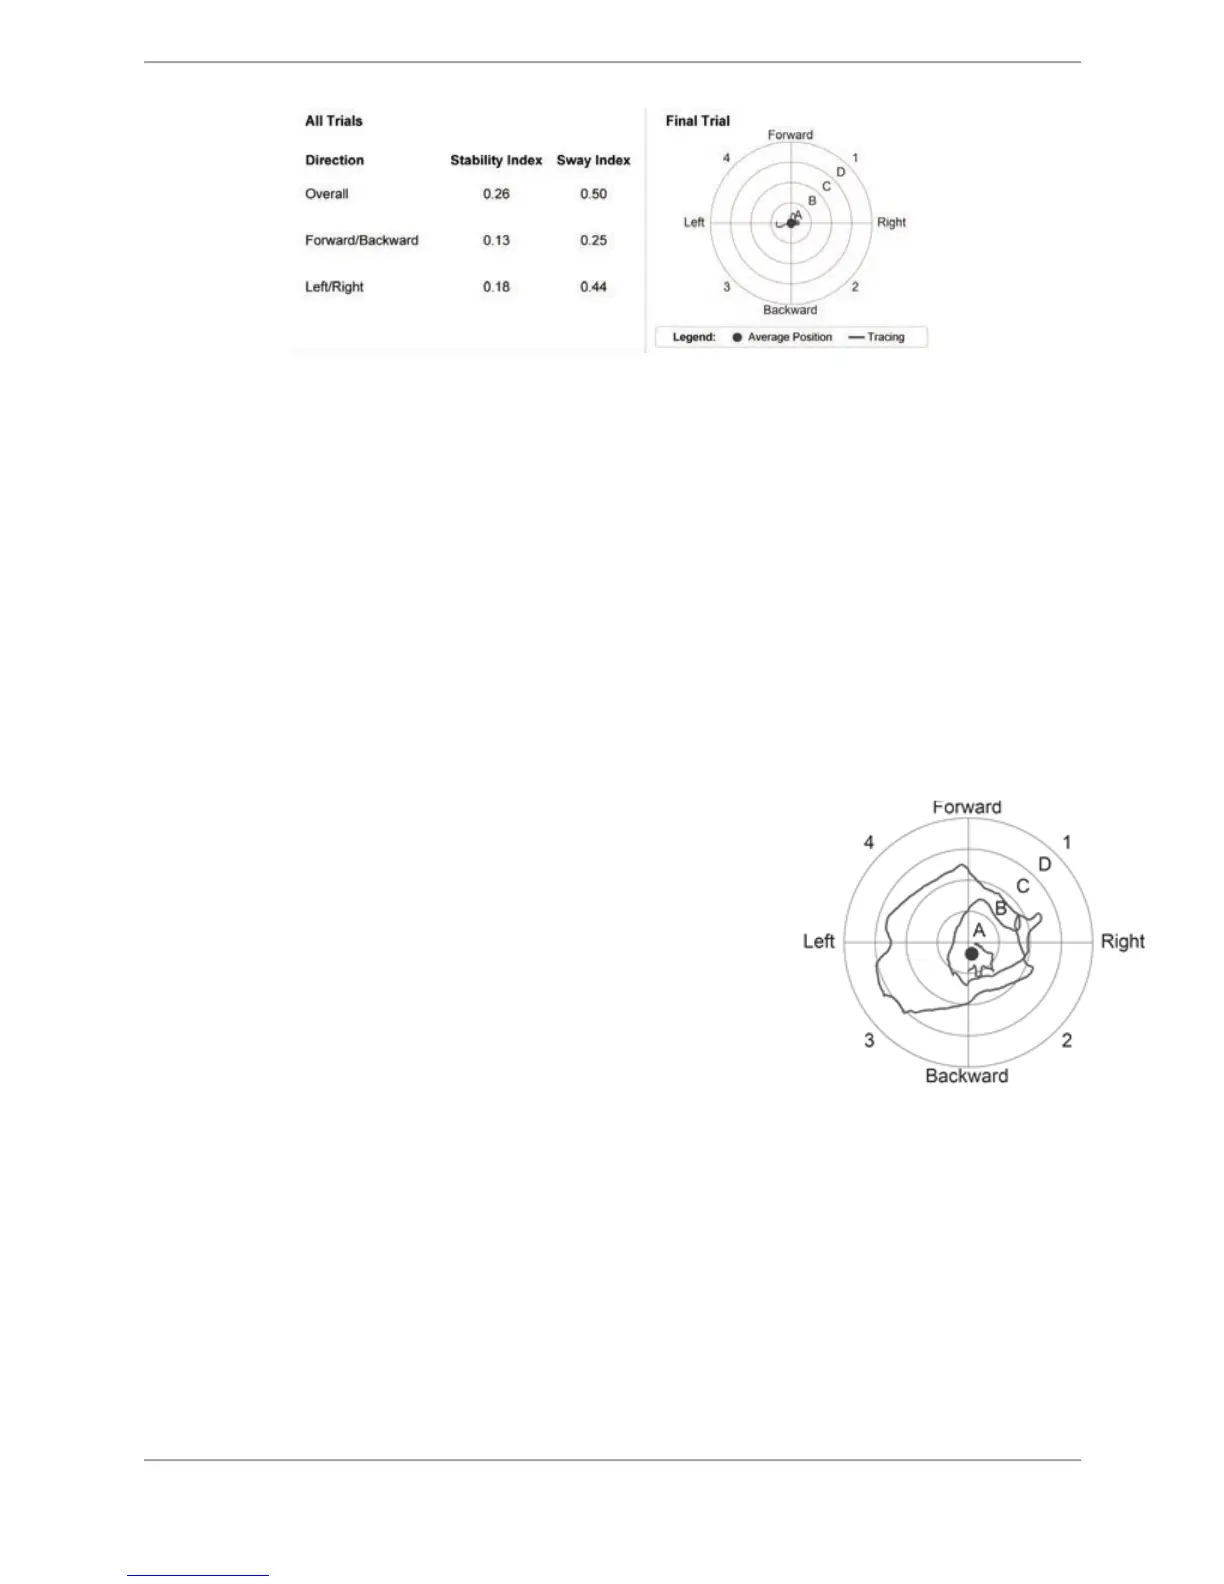
Figure B.3. Sample Postural Stability Test Data.
Where:
Stability Index: is the average position from center.
Sway Index: is the Root Mean Square distance for the X, Y coordinates over the course of
the test.
Note: Refer to for Appendix A for the equation for Stability and Sway Index.
Percent Time In Zone/Quadrant: These values represent the percentage of test time the patient
spends in each zone/quadrant during the test.
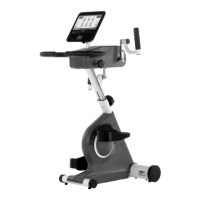
The target zones, A, B, C, and D, are equal to specific ranges of deflection and radiate in
concentric circles from the center of the foot platform as follows:
• Zone A = zero to five degrees platform deflection from level.
• Zone B = six to ten degrees platform deflection from level.
• Zone C = 11 - 15 degrees platform deflection from level.
• Zone D = 16 - 20 degrees platform deflection from level.
Quadrants represent the four quarters of the Test Grid in the
X and Y axis as follows:
• Quadrant 1 = right forward (anterior).
• Quadrant 2 = right backward (posterior).
• Quadrant 3 = left backward (posterior).
• Quadrant 4 = left forward (anterior).
!
Figure B.4. Target Zone/Quadrant Diagram.