132 Biodex Medical Systems, Inc. © 2017
Motor Control Test Data Interpretation
This test is a good indicator of dynamic control within a normalized sway envelope. Poor
control, inconsistent, or increased times suggests further assessment for lower extremity
strength, proprioception, vestibular, or visual deficiencies.
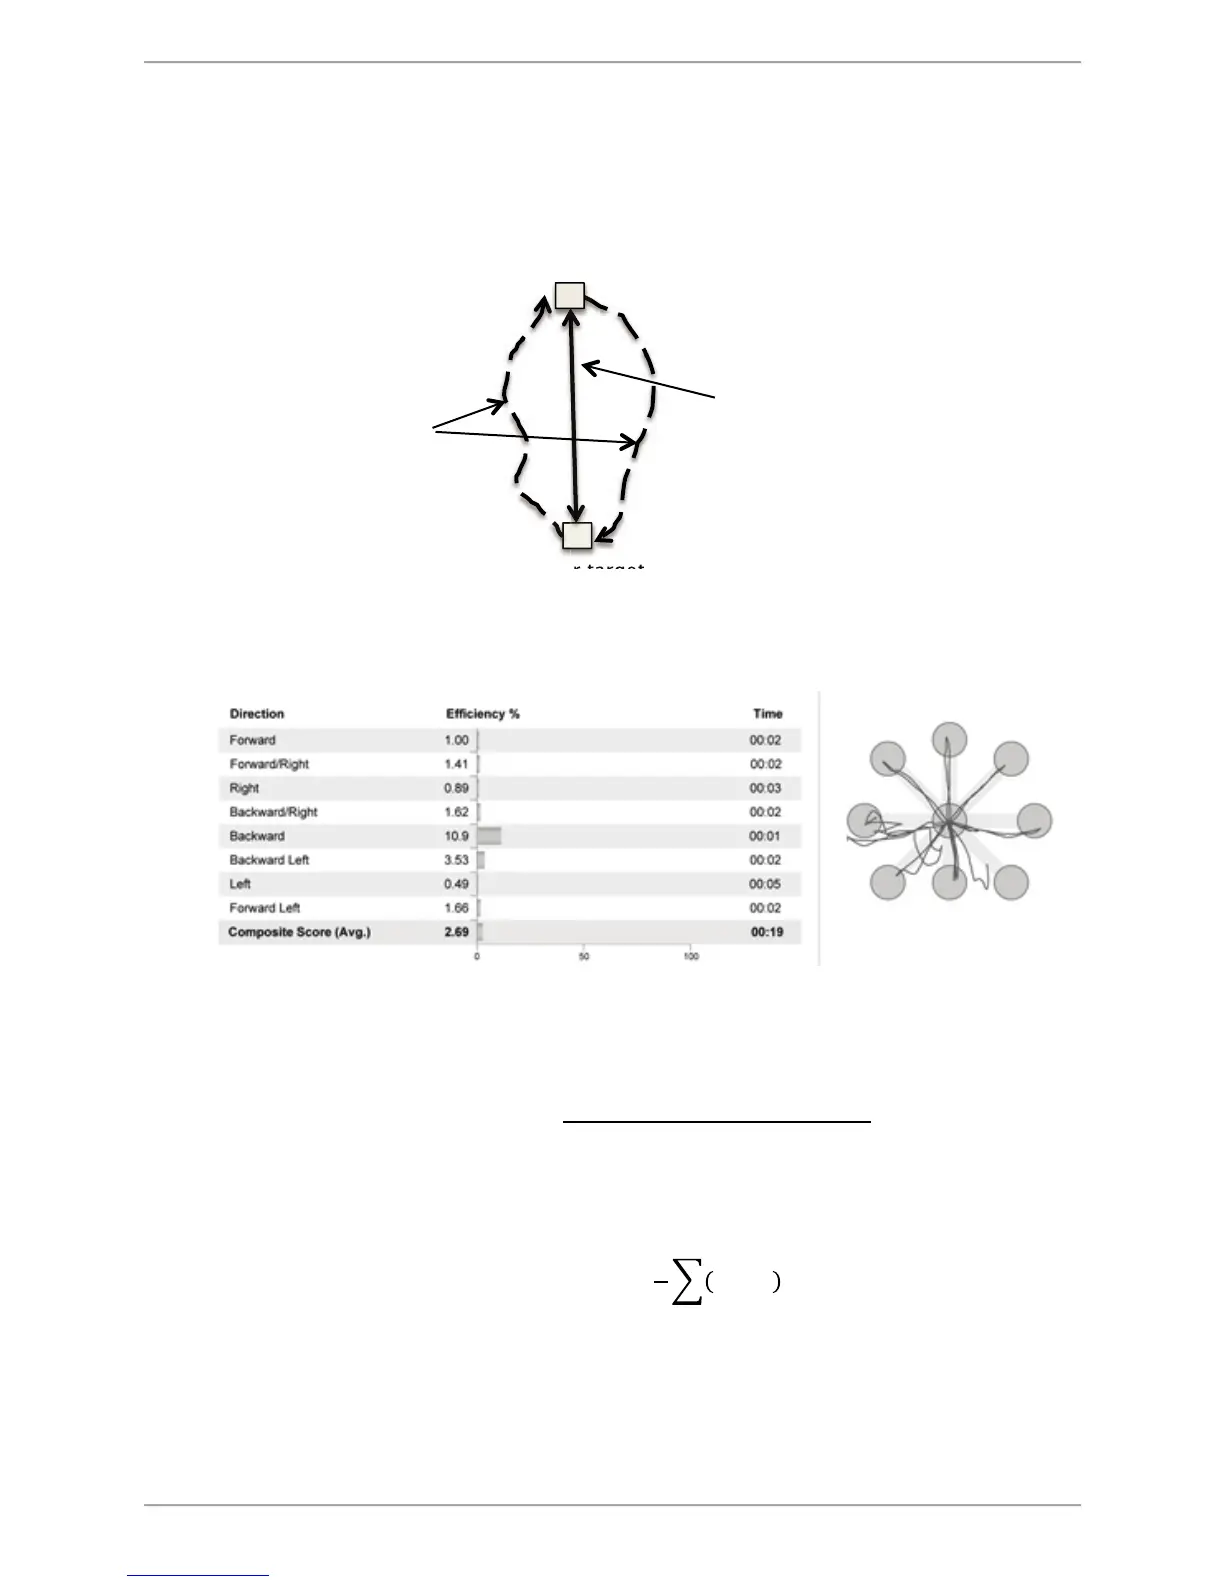
Figure B.6. Sample of Data Taken from a Motor Control Report.
As noted in Appendix A, the Calculation of Direction Efficiency %:
!"#$%&"'(!!""#$#%&$'! !
!"#$%&!!!!"#$!!"#$%&'(!!!!
!"#$%&!!"#$%&'(!!"!!"#!!"#$
!!!!""
Composite Score: The average of all the eight targets for a Full pattern. For a Left or Right
pattern, it is the average of five targets.
!"#$"%&'(!!"#$% !
!
!
!"##
!
!!!
Where ! = Number of Targets.
Actual Distance Traveled (trace)
Straight Line Distance between targets
Center target
Figure B.5. Limits of Stability Direction Control Diagram.