Balance System SD (with v4.X software) 133
Fall Risk Test Data Interpretation
With force platform technology, an objective quantification of the patient’s postural sway
velocity can be used to predict risk. Velocity can be described as the speed of an individual's
sway as balance is maintained. Higher velocities, when cues are given to specifically stand ‘as
motionless as possible’, are suggestive of postural control deficits.
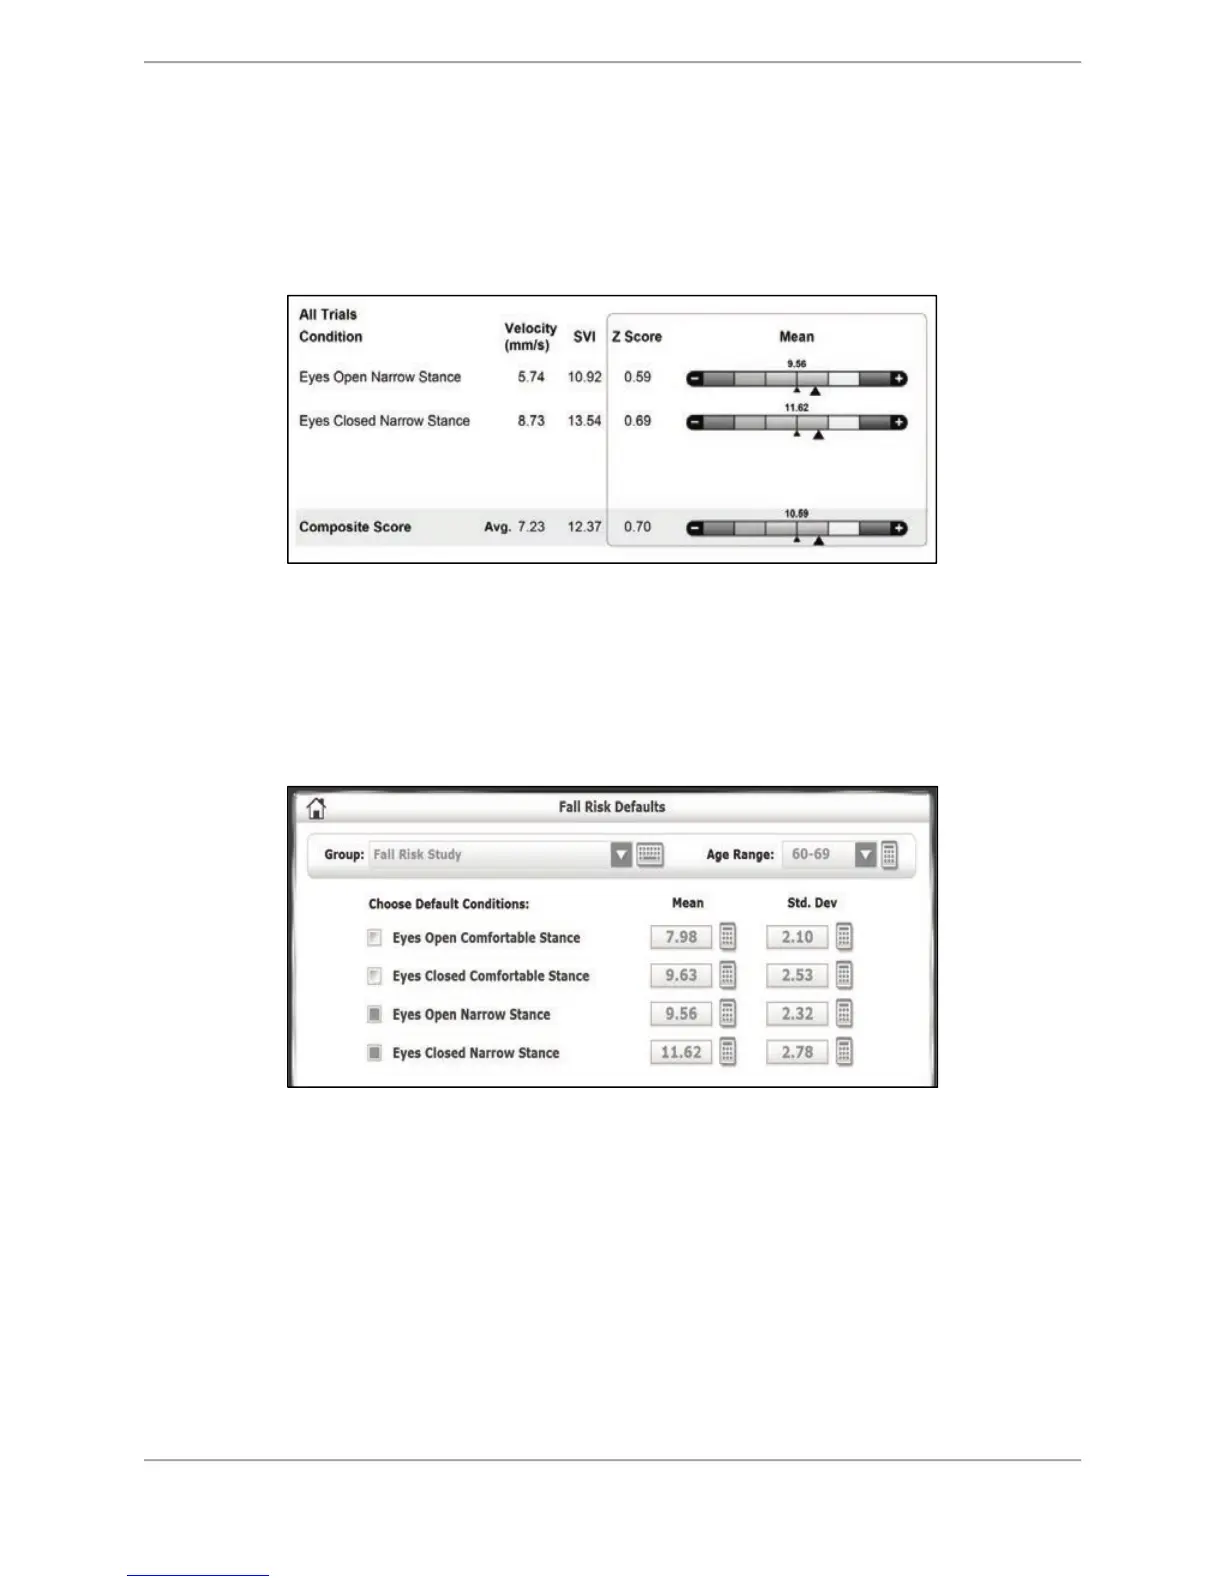
Figure B.7.
For details of Sway Velocity Index, see the Appendix A.
This value is compared to normative data as a Z score. A Z score indicates how many standard
deviations SVI is from the mean.
In this example (taken from the Normative data for this test), each box (green, yellow, red,
purple) on the normative bar represents one standard deviation that can be found on the Fall
Risk Default of that Age group (e.g., 60-69 for this example), which has a standard deviation
value of 2.32.
Therefore, using the above formula:
Z Score = (10.92-9.56) / 2.32 = 0.5862.
Figure B.7. Sample Data Taken from a Fall Risk Test.
Figure B.8. Fall Risk Defaults Screen.