Balance System SD (with v4.X software) 139
Segment B – X,Y Coordinate Data Points
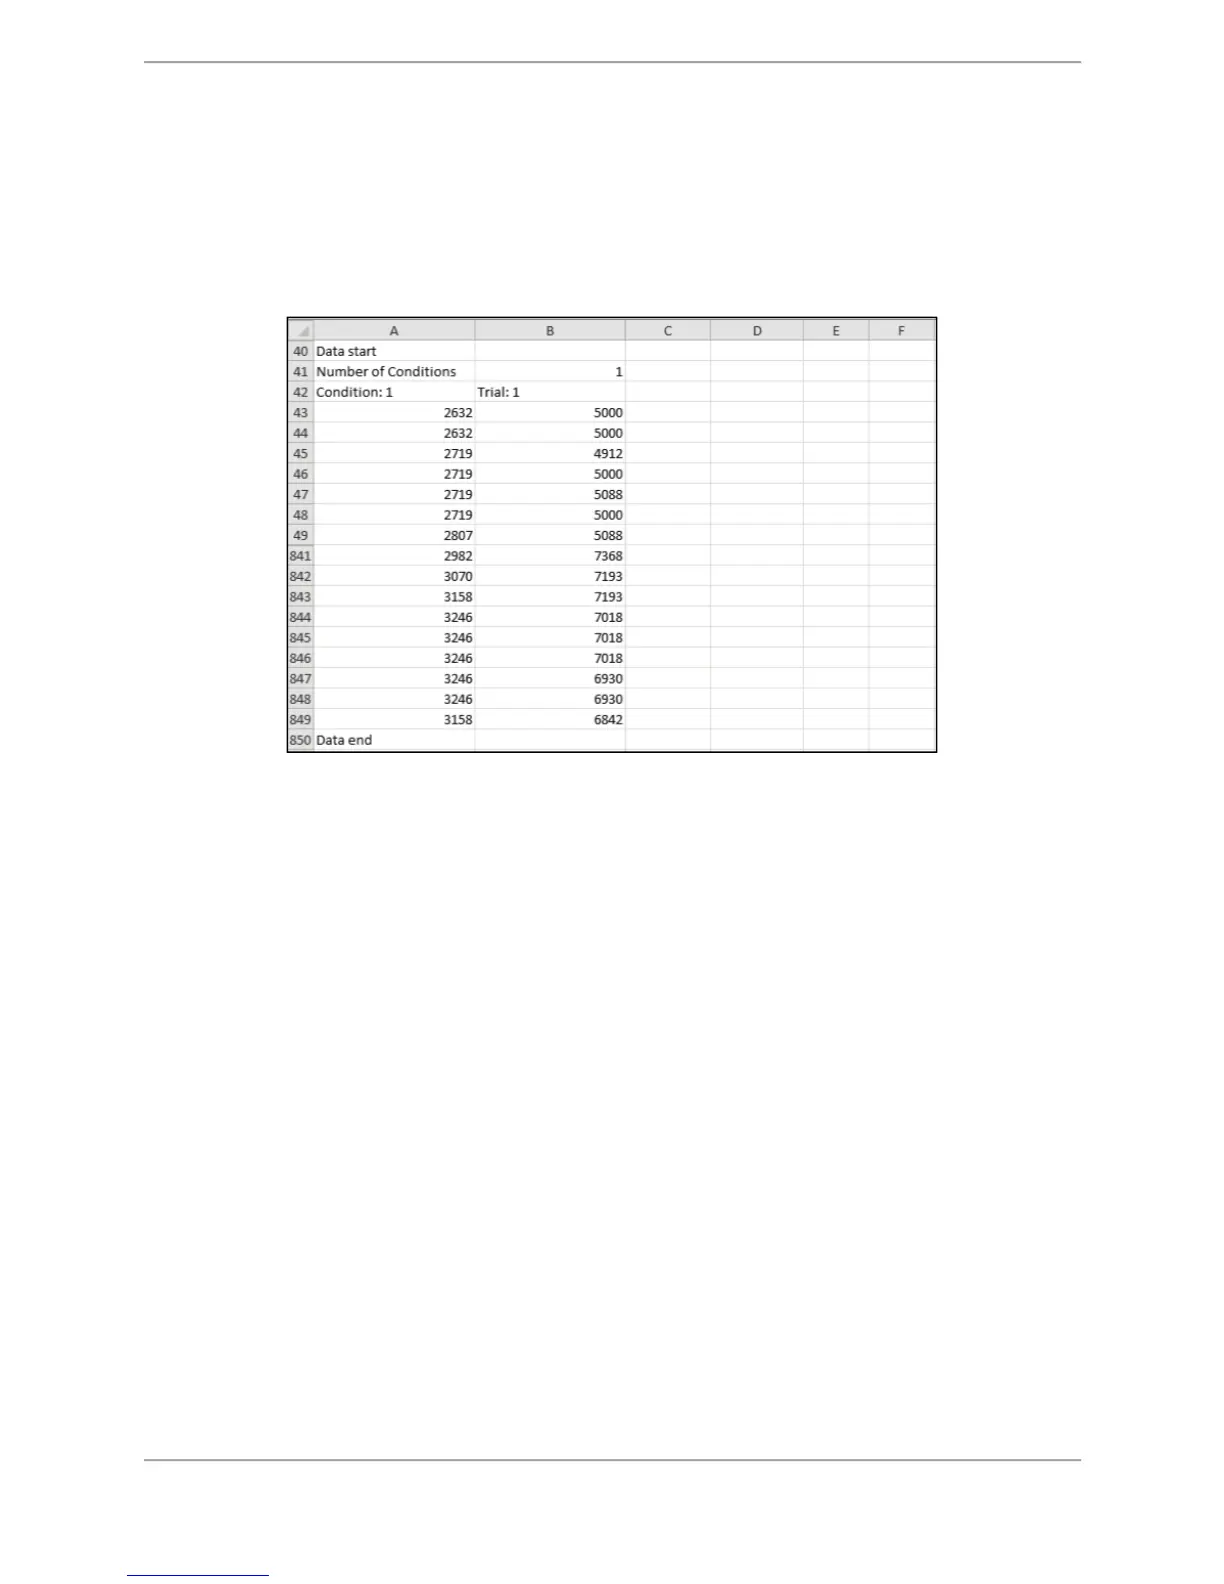
This segment describes the X,Y coordinate data points. It starts within the record containing the
words ‘Data start’ (as illustrated in the left column of the following table) and ends with the
record containing the words ‘Data end’. All test/exercise results have a Data Start and a Data
end point. In this example, the data point values displayed as -61,36 represent the X
coordinate value as -61 and the Y coordinate as 36.
Figure C.3. CSV File Format Explanation – Data Points.
Each point is an X,Y rectangular coordinate, where 0, 0 is the center of the graph, to the left is
negative X, and to the bottom is negative Y. The data points are generated at a sample rate of
40 per second.
X, Y Scaling
For all tests and exercises performed in Dynamic mode (available in Balance SD only), the X,Y
coordinate data is scaled to 1/100th degrees for a range of 20 degrees (up to a maximum value
of 2,000) of platform tilt. For tests with the yellow-ringed background, each ring represents
approximately 5 degrees of platform tilt. For LOS, the farthest targets (center of target) at the
most difficult level represent 8 degrees of platform tilt (value of approximate 800).
For all tests and exercises performed in Static mode, the X,Y coordinate data is scaled to
1/100th for a range of 20 (up to a maximum value of 2,000), mapped to 8 degrees of body tilt
angle. For example, 8 degrees of body tilt is a value of 2,000, and 2 degrees of body tilt is a
value of 500. For tests with the yellow-ringed background, each ring represents approximately
2 degrees of body tilt. For LOS, the farthest targets (center of target) at the most difficult level
represent 8 degrees of body tilt (value of 2,000).