S10/S12/S10A/S12A Patient Monitor User’s Manual
17-2
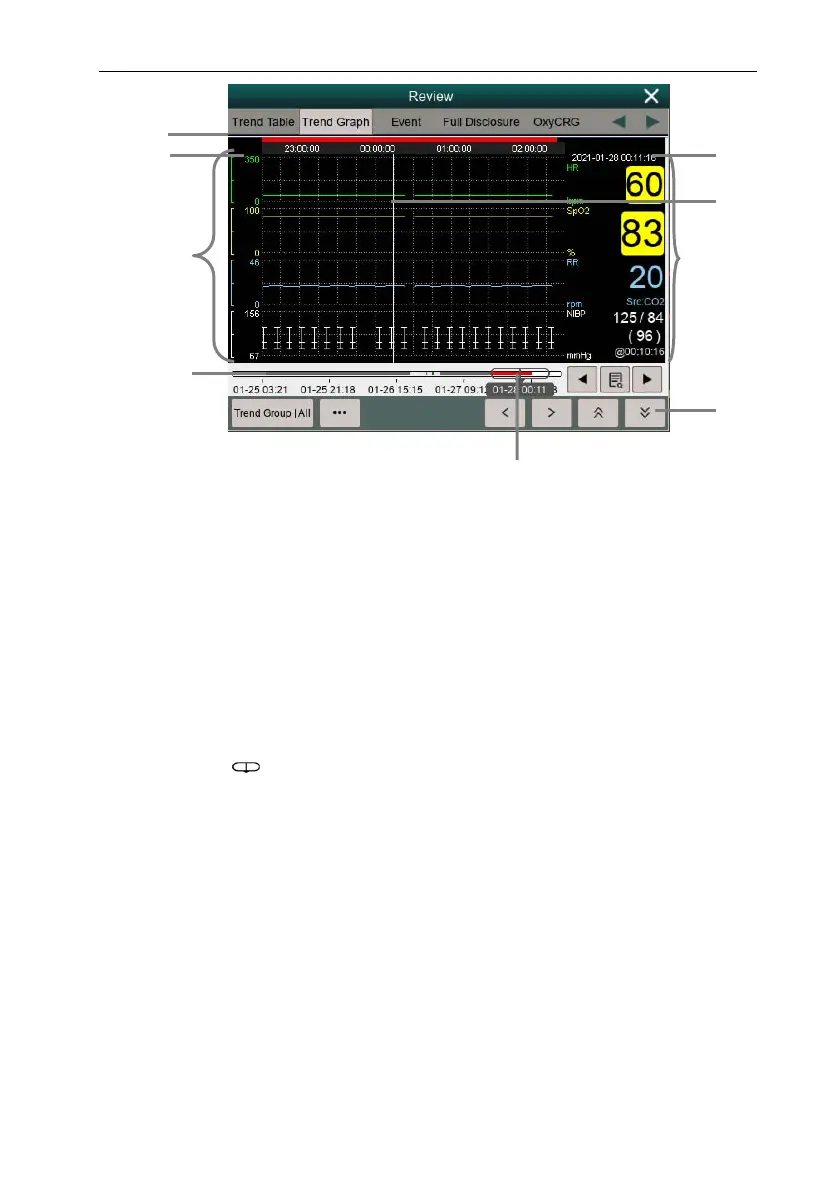
(1) Event type indicator: Different color blocks match different types of events.
• Red: high priority alarm event
• Yellow: medium priority alarm event
• Cyan: low priority alarm event
(2) Current window time line: indicates the time length of the current window.
(3) Waveform area: display trend curves. The color of trend curves is consistent with
the color of parameter labels.
(4) Time line:
can be moved within this time length.
Different color blocks at the time line indicate alarm events of different
types. The color of the color block is consistent with the color of the
event identifier.
(5) Cursor time
(6) Cursor
(7) Waveform area: displays the parameter value at the cursor time.
(8) Button area
(9) Slider: indicates the position of current window time in the entire time length.
Dragging this button left or right enables you to locate the trend data at a specific
time and also refreshes trend data in current window accordingly.
9
4
8
6
7
5
3
1
2
 Loading...