77
MC-III™ Panel Mount Flow Analyzer Section 5
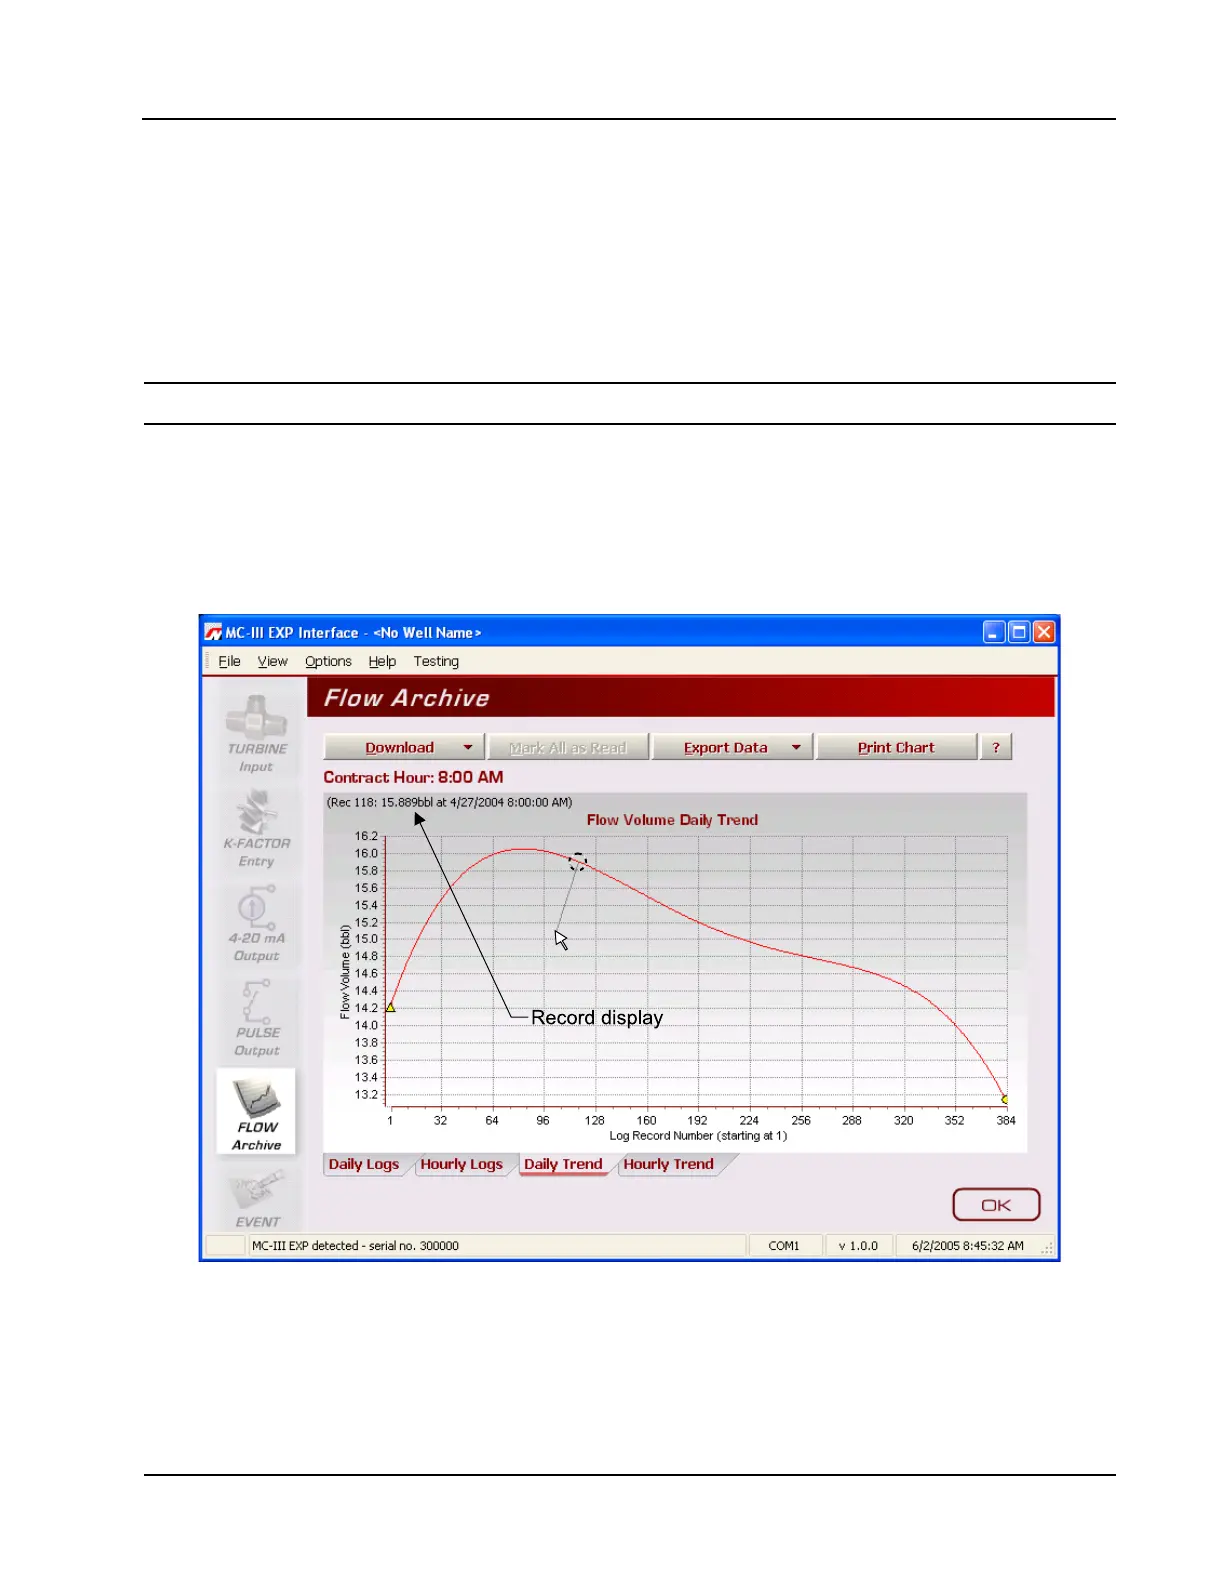
Viewing Trend Charts
In the daily and hourly trend views, ow volumes are charted on a grid, with ow record numbers forming
the horizontal axis, and ow volumes shown on the vertical axis. A graphical line dened by two yellow
endpoints represents the range of archived logs available for viewing. A yellow triangle marks the rst record,
and a yellow circle marks the nal record. The arrowhead cursor is paired with a dotted circle. As the user
drags the cursor across the chart, the circle’s position corresponds with the record displayed at the top of the
screen (Figure 5.6). The circle’s snap function allows the user to pinpoint transitional points within the trend
display; the greater the zoom, the more precise the navigation.
Important: The interactive cursor cannot be turned off.
• To zoom in, left-click and drag the mouse to the right and down.
• To zoom out, drag the mouse up and to the left.
• To reposition the chart within the viewing window, right-click the chart and move the mouse slowly in
any direction.
• To exit the page and return to the Main screen, press OK.
Figure 5.6—Flow Archive screen, trend view
Printing/Saving a Report
A ow log can be printed and/or saved as a table (Figure 5.7, page 78) or a trend chart (Figure 5.8, page
79).
To print a log, select the appropriate tab at the bottom of the Flow Archive screen, and press the “Print”