Viewing Fan Sensors
Procedure
Step 1
In the Navigation pane, click the Server tab.
Step 2
On the Server tab, click Sensors.
Step 3
In the Sensors pane, click the Fan tab.
Step 4
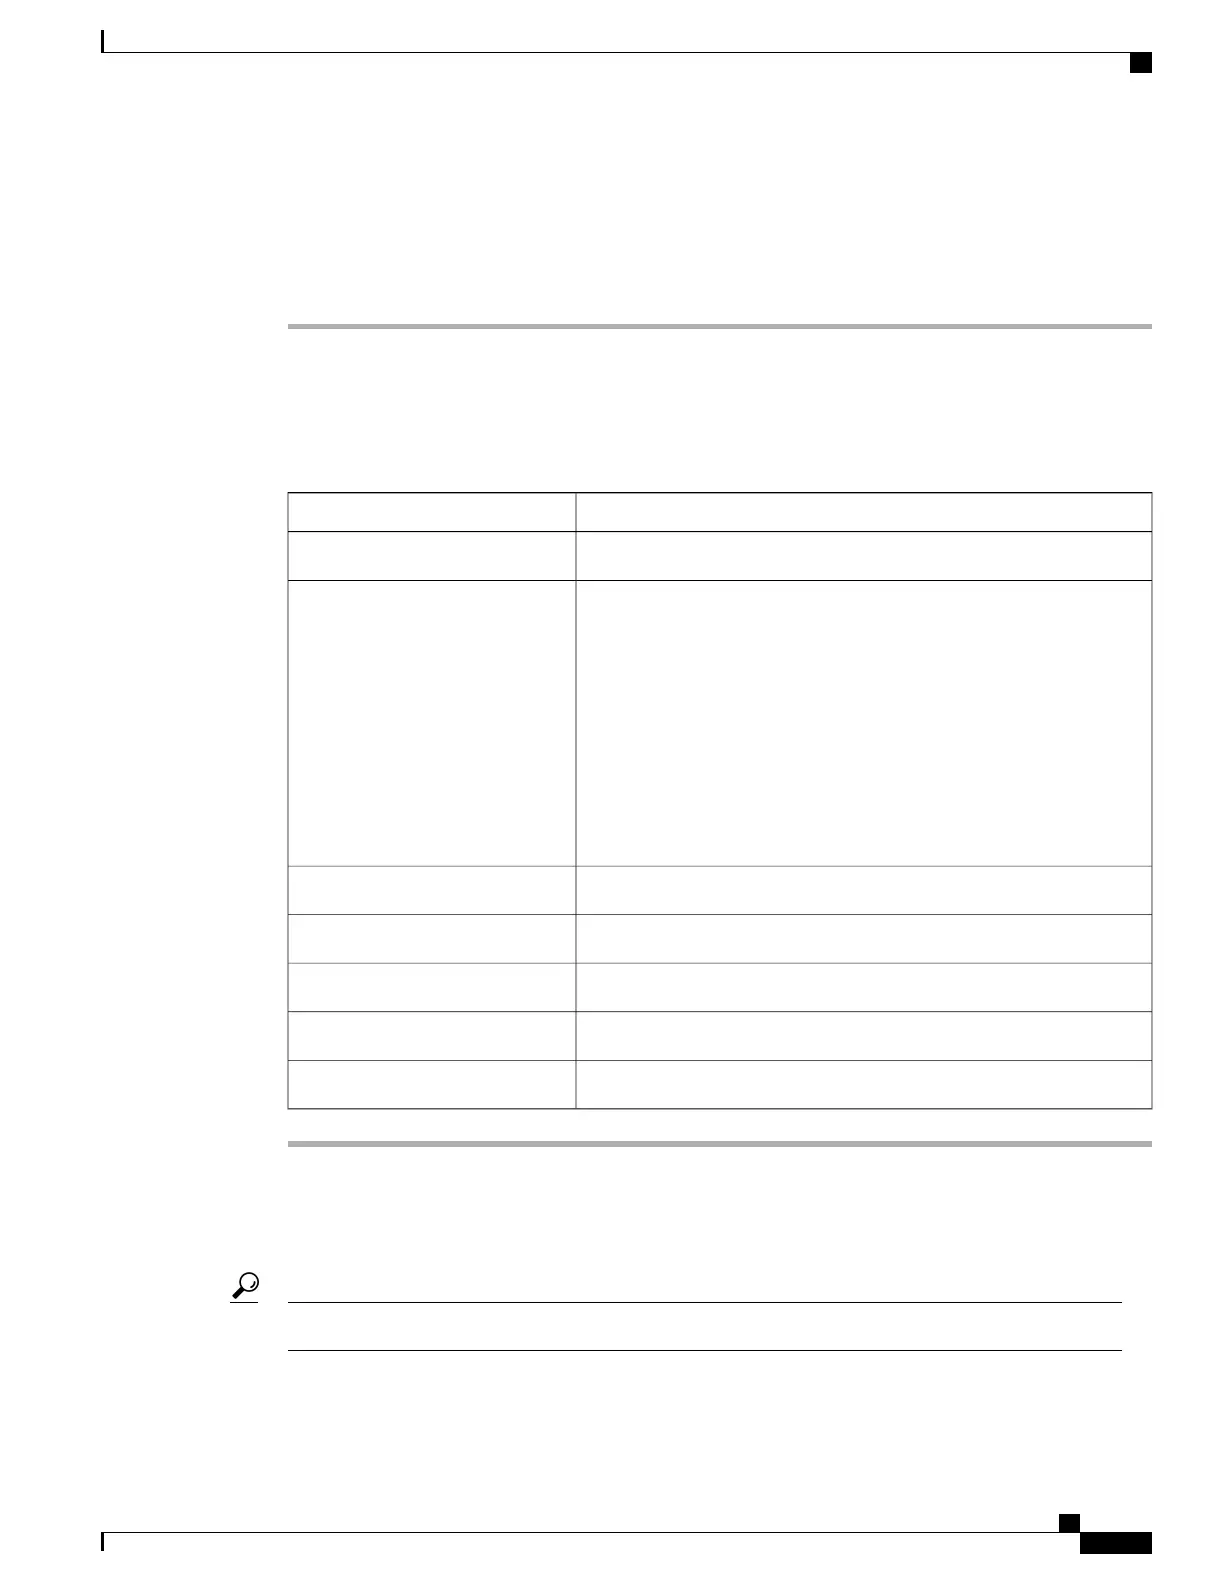
View the following fan-related statistics for the server:
Click a column header to sort the table rows according to the entries in that column.Tip
DescriptionName
The name of the sensor.Sensor Name column
The status of the sensor. This can be:Status column
• Unknown
• Informational
• Normal
• Warning
• Critical
• Non-Recoverable
The fan speed in RPM.Speed column
The minimum warning threshold.Warning Threshold Min column
The maximum warning threshold.Warning Threshold Max column
The minimum critical threshold.Critical Threshold Min column
The maximum critical threshold.Critical Threshold Max column
Viewing Power Supply Sensors
Click a column header to sort the table rows according to the entries in that column.Tip
Cisco UCS C-Series Servers Integrated Management Controller GUI Configuration Guide, Release 1.1(2)
OL-22894-01 27
Viewing Server Sensors
Viewing Fan Sensors
 Loading...