Procedure
Step 1
In the Navigation pane, click the Server tab.
Step 2
On the Server tab, click Sensors.
Step 3
In the Sensors pane, click the Power Supply tab.
Step 4
In the Properties area, the Redundancy Status field displays the status of the power supply redundancy of
the server.
Step 5
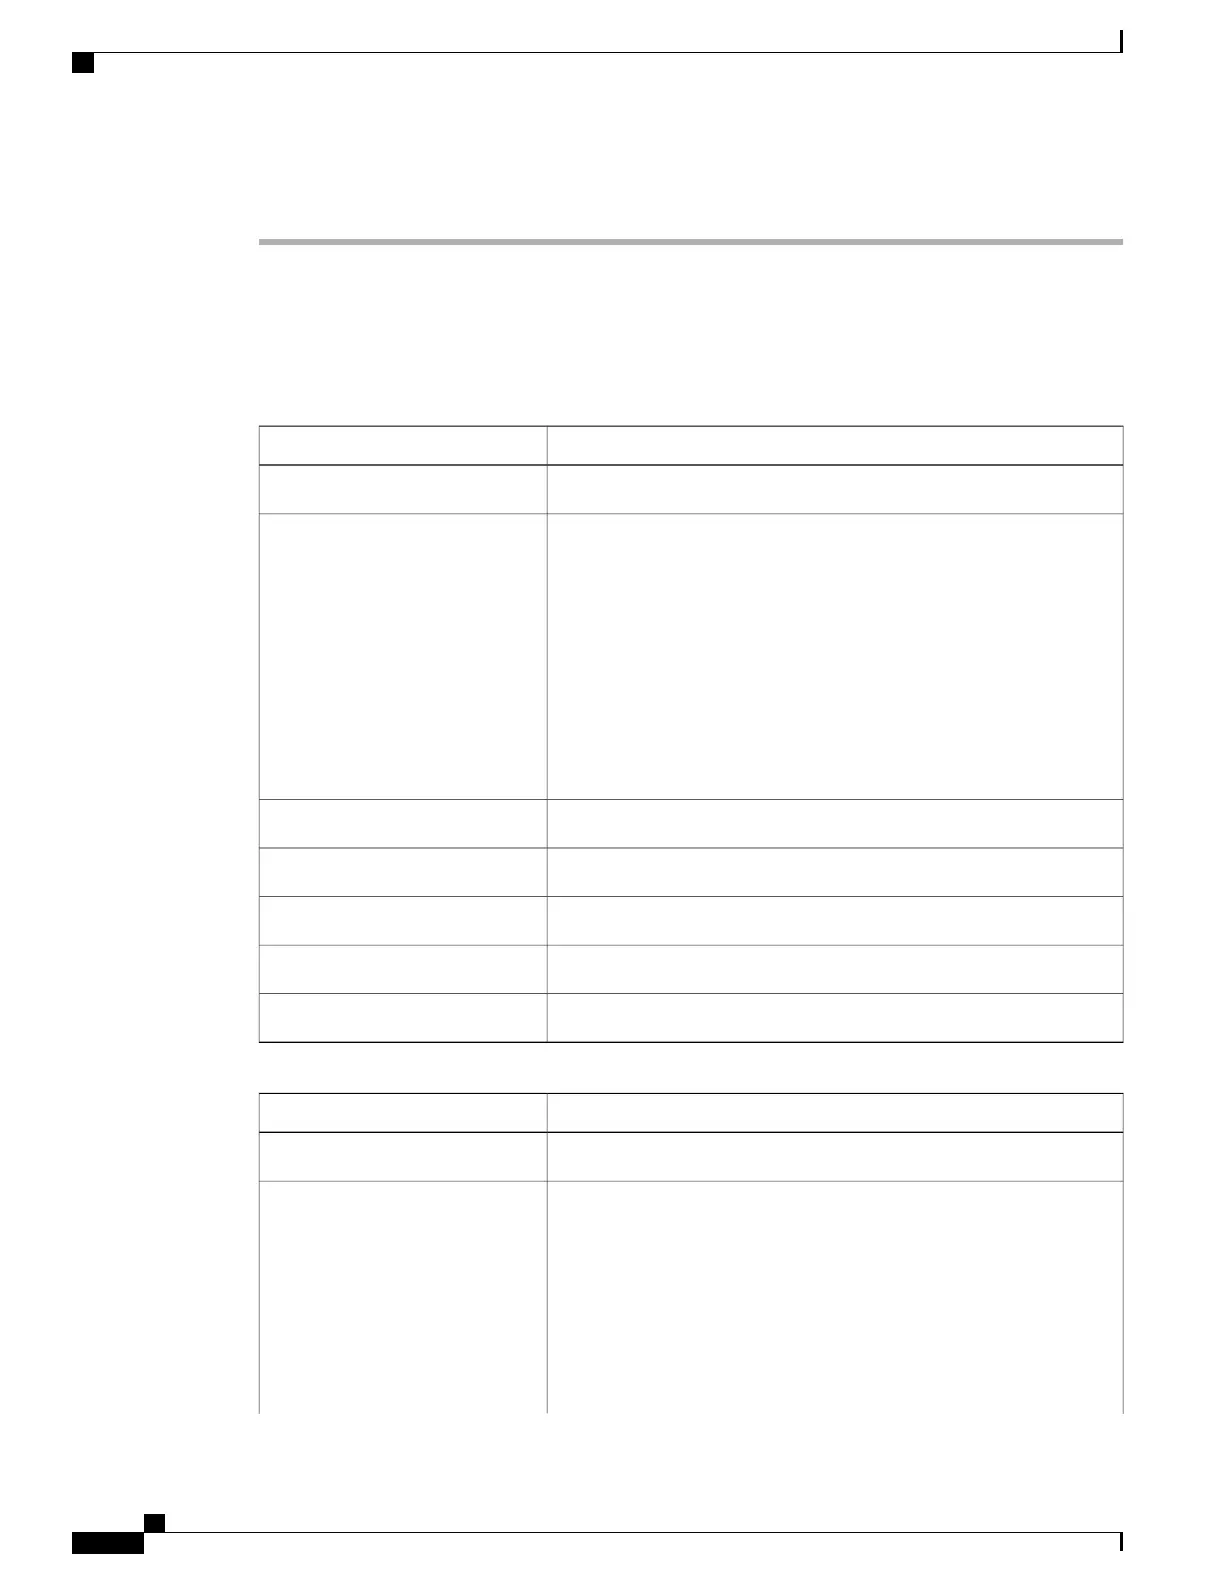
In the Threshold Sensors area, you can view the following statistics for the server:
DescriptionName
The name of the sensor.Sensor Name column
The status of the sensor. This can be:Status column
• Unknown
• Informational
• Normal
• Warning
• Critical
• Non-Recoverable
The current power supply usage, in watts.Reading column
The minimum warning threshold.Warning Threshold Min column
The maximum warning threshold.Warning Threshold Max column
The minimum critical threshold.Critical Threshold Min column
The maximum critical threshold.Critical Threshold Max column
Step 6
In the Discrete Sensors area, you can view the following statistics for the server:
DescriptionName
The name of the sensor.Sensor Name column
The status of the sensor. This can be:Status column
• Unknown
• Informational
• Normal
• Warning
• Critical
Cisco UCS C-Series Servers Integrated Management Controller GUI Configuration Guide, Release 1.1(2)
28 OL-22894-01
Viewing Server Sensors
Viewing Power Supply Sensors
 Loading...