table - average calculation method:
The table outlines the sections' Parameters including Definition:
Frequency – 10 seconds averaging
Average Measurements at an aggregation of 150/180 cycles (~3seconds)
Average Measurements at an aggregation of 10 minutes
Average Measurements at an aggregation of 2 hours
Under Deviation
150/180 Cycles
Displays how much lower the Average RMS Voltage is than the Reference
Voltage at an aggregation of 150/180 cycles (~3seconds)
Displays how much lower the Average RMS Voltage is than the Reference
Voltage at an aggregation of 10 minutes
Displays how much lower the Average RMS Voltage is than the Reference
Voltage at an aggregation of 2 hours
Over Deviation
150/180 Cycles
Displays how much higher the Average RMS Voltage is than the Reference
Voltage at an aggregation of 150/180 cycles (~3seconds)
Displays how much higher the Average RMS Voltage is than the Reference
Voltage at an aggregation of 10 minutes
Displays how much higher the Average RMS Voltage is than the Reference
Voltage at an aggregation of 2 hours
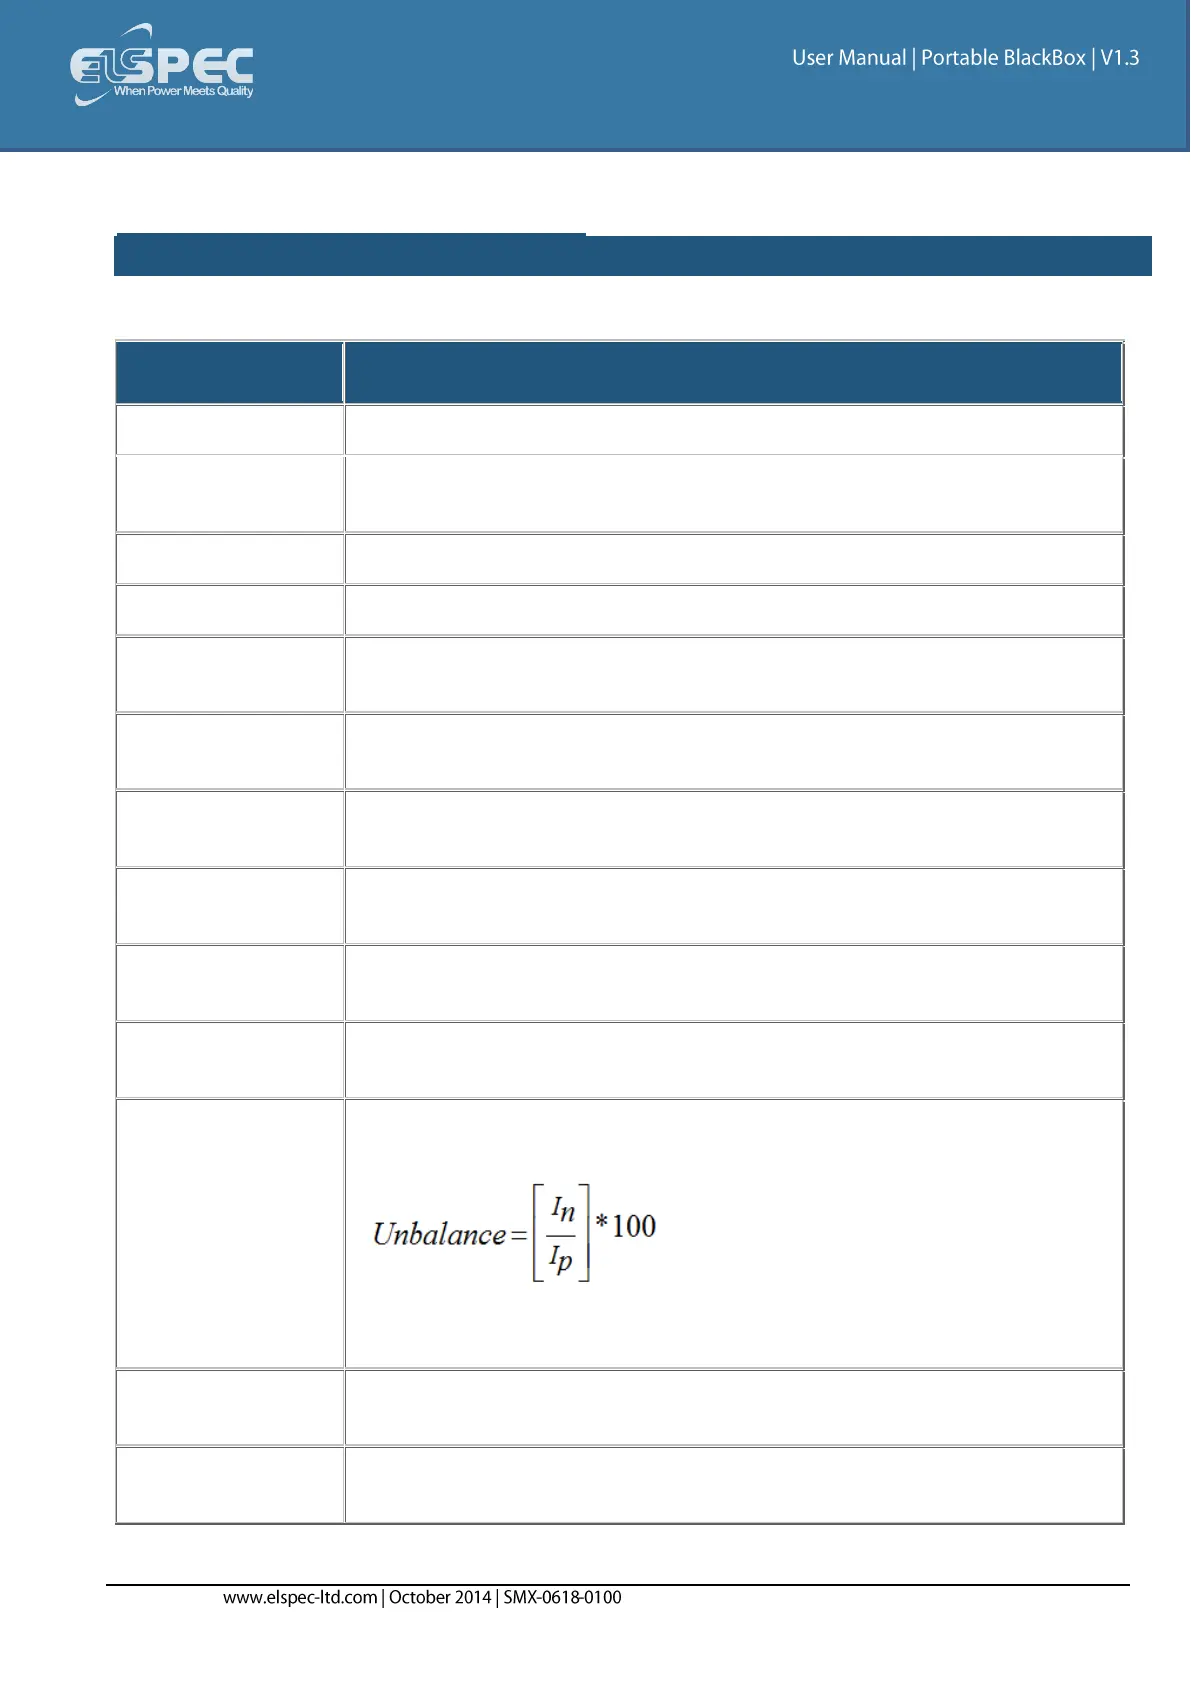
The Supply Voltage Unbalance is Evaluated Using the Method of
Symmetrical Components in Accordance with IEC61000-4-30:
This entry displays the Average Maximum/Minimum Unbalanced Values at
an aggregation of 150/180 cycles (~3seconds)
This entry displays the Average Maximum/Minimum Unbalanced Values at
an aggregation of 10 minutes
This entry displays the Average Maximum/Minimum Unbalanced Values at
an aggregation of 2 hours