Traffic summary and security events Traffic Summaries
FortiAnalyzer Version 3.0 MR3 Administration Guide
05-30003-0082-20060925 111
When viewing real-time logs, you cannot filter on the time column because the
time will always be the current time.
Filtering tip
When filtering by source or destination IP, you can use the following in the filtering
criteria:
• a single address (2.2.2.2)
• an address range using a wild card (1.2.2.*)
• an address range (1.2.2.1-1.2.2.100)
You can also use the boolean operator "or" to indicate multiple choices:
• 1.1.1.1 or 2.2.2.2
• 1.1.1.1 or 2.2.2.*
• 1.1.1.1 or 2.2.2.1-2.2.2.10
Device Summary
The device summary provides a graphical analysis of the network traffic by
FortiGate unit. The summary provides graphical details in real-time for all
FortiGate units, by group or individually. All FortiGate units appearing must be
properly registered with the FortiAnalyzer unit.
The device summaries include:
• Protocol distribution - the overall protocol traffic and breakdown by upload and
download traffic.
• Web and FTP - traffic by host, top FTP and web server and volume.
• Email - top SMTP, POP3 and IMAP servers and top email sender activity.
• Multimedia - top RTSP and MMS server activity.
To view the device summary graphs, go to Network Summary > Device
Summary.
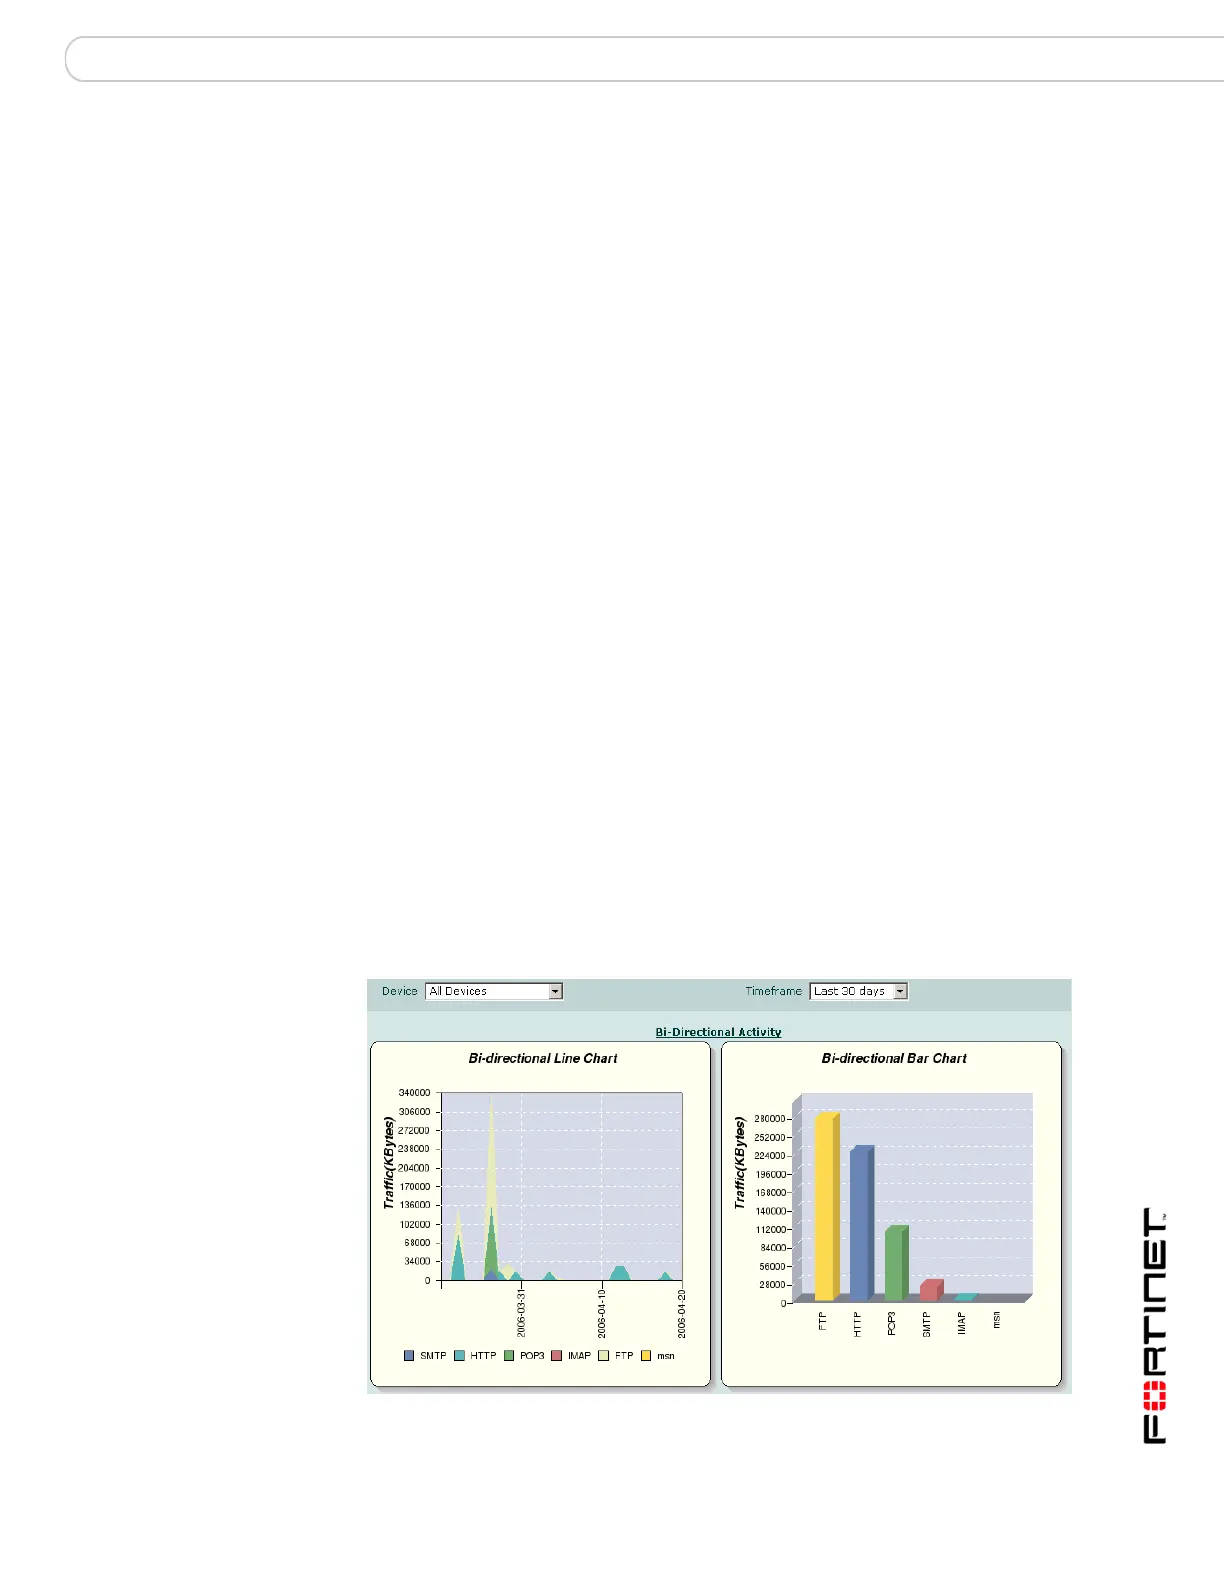
Figure 48: Viewing protocol distribution
 Loading...