Configure the FortiAnalyzer unit Dashboard
FortiAnalyzer Version 3.0 MR3 Administration Guide
05-30003-0082-20060925 31
Filtering session information
You can filter the contents to find specific content. Each column of data includes a
gray filter icon. Select the icon to filter the contents of the column.
When applying a column filter, the filter icon appears green.
To turn off the filter, select the filter icon for the column, and select Clear all Filters.
Viewing Alert messages
Alert messages provides a window on what is occurring on the FortiAnalyzer and
other FortiGate devices. It enables you to view issues on your network, including
network attacks and virus warnings. The Alert messages window provides a
complete list of alert messages. You can view the alert messages by level and
delete the messages as required.
To view the alert messages
1 Go to System > Dashboard.
2 Select More Alerts in the upper right corner of the Alert Message Console area.
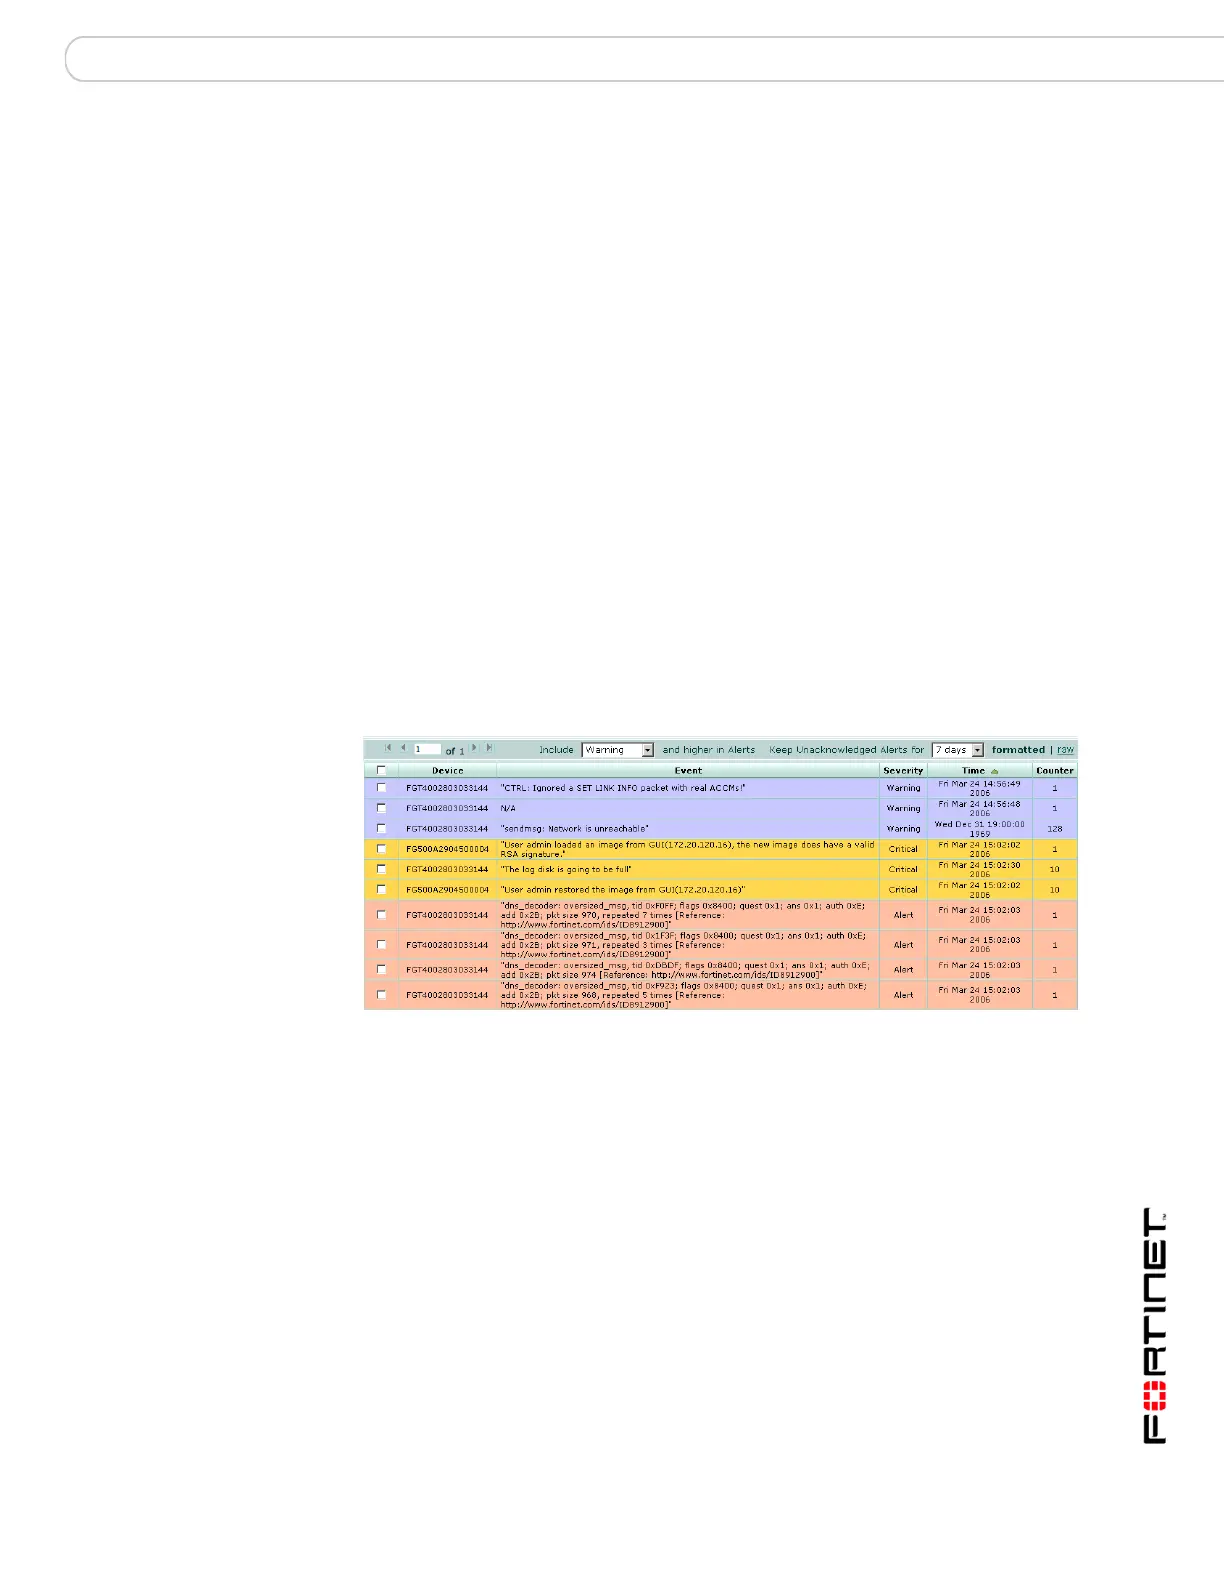
Figure 3: Alert messages
To Port The destination port of the connection.
Expires (Secs) The time in seconds remaining before the connection terminates.
Page Select the page of alerts to view. Use the arrows to move forward
and back through the pages or enter a page number and press
Enter.
Include...and higher
in alerts
Select an alert level to view. The level you select and those alert
messages higher than selected will appear in the alert list.
Keep
unacknowledged
alerts for
Select the number of previous days of alert messages to display.
Selecting a number of days lower than what you are currently
viewing deletes the older alerts. For example, if you are viewing
alerts for seven days, and change the alerts to two days, the
FortiAnalyzer unit deletes the other five days of alert messages.
Formatted | Raw Select to view the alert messages in a formatted or raw format.
Device The device where the alert message is originating.
Event Details of the event causing the alert message.
Severity The level of the alert message.
Time The date and time of the alert message.
 Loading...