190
8 Maintenance
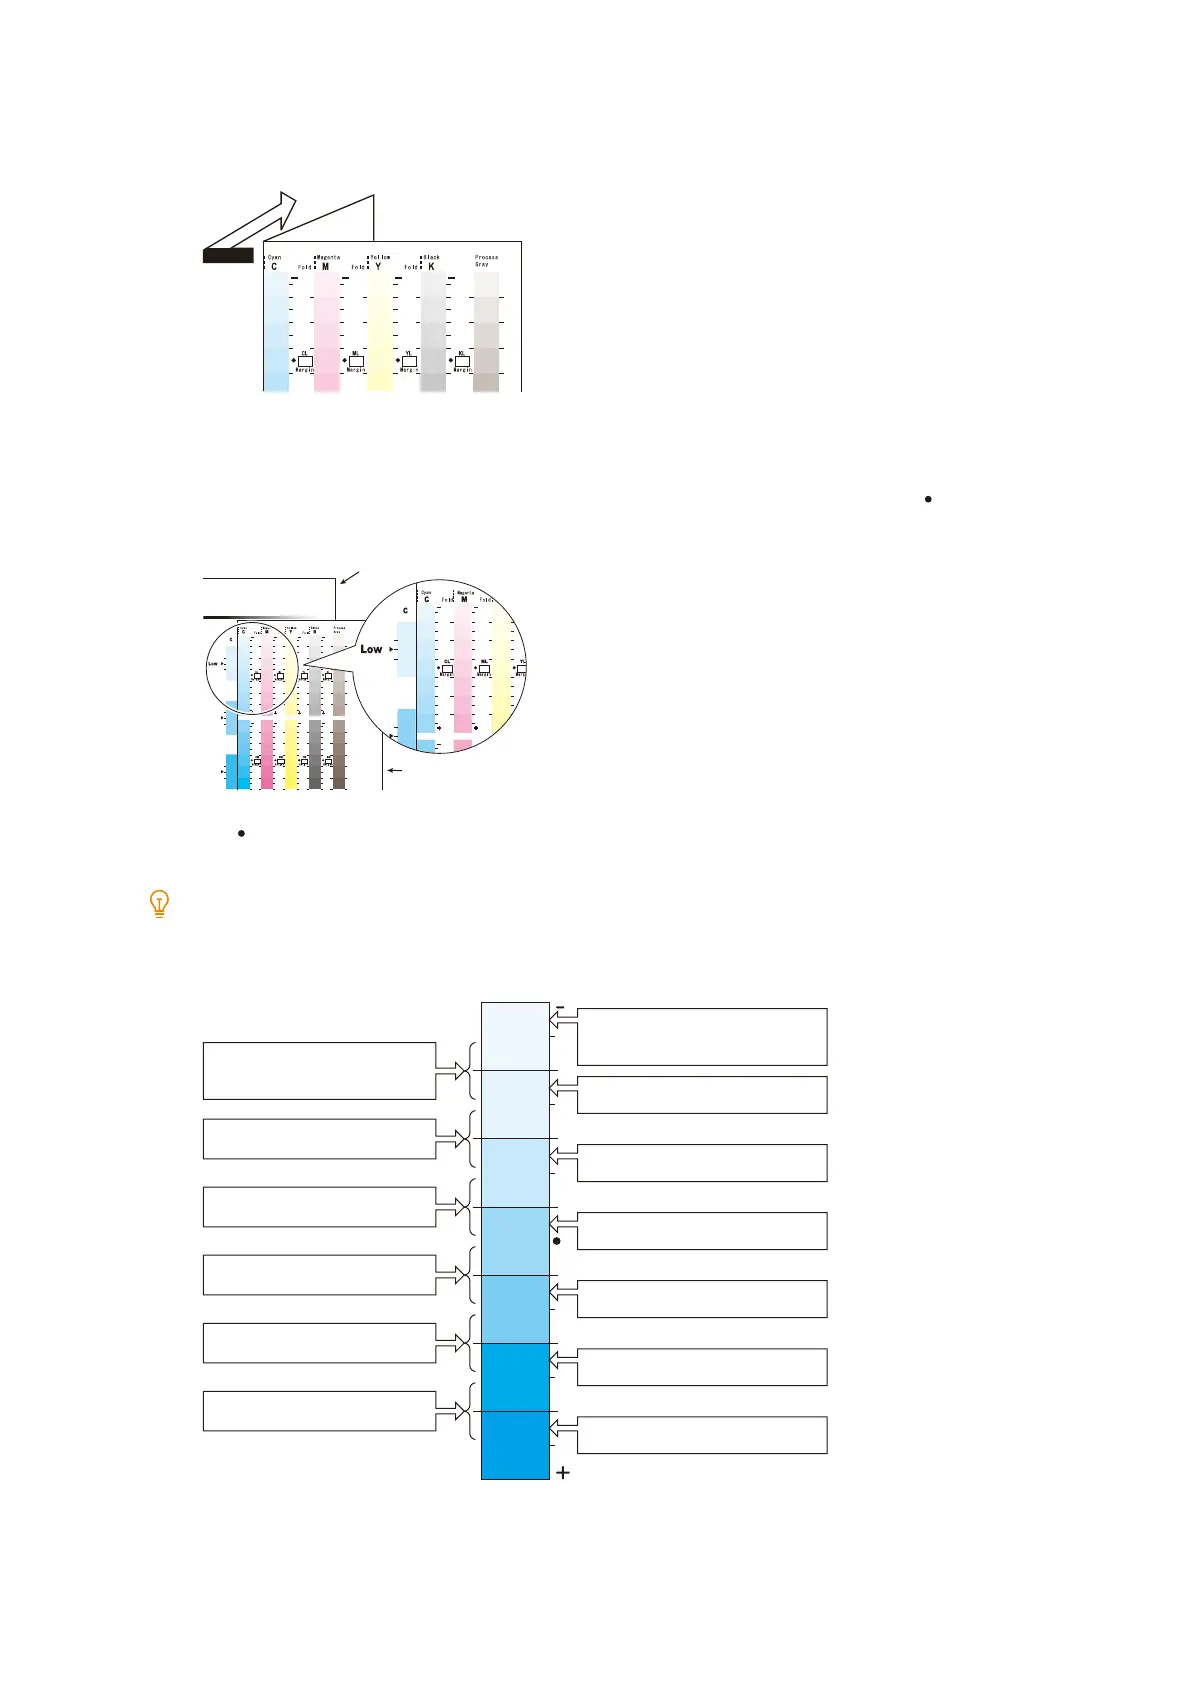
1. Fold the printed halftone adjustment chart in a peak fold along the vertical guide line (dotted line) of the color
to adjust.
2. Match the density of the halftone adjustment chart to adjust with the location of the same density on the
calibration sample.
Example: To correct low density, match Low of the gradation correction color sample and the mark of Low of the
gradation correction chart.
3. Using the symbol on the halftone adjustment chart as the starting point, slide the halftone adjustment
chart vertically to read the variance with the calibration sample from the tick marks.
Note
Read the variance while noting the orientation of the - and + marks.
Color Sample
Calibration Chart
Measurement part of Calibration Chart
<-5> if density of Color Sample is
close the density in-between.
<-3> if it is close the density
in-between.
<-1> if it is close the density
in-between.
<+1> if it is close the density
in-between.
<+3> if it is close the density
in-between.
<+5> if it is close the density
in-between.
<-6> if density of Color Sample is
close the density here.
<-4> if it is close the density here.
<-2> if it is close the density here.
<0> if it is close the density here.
<+2> if it is close the density here.
<+4> if it is close the density here.
<+6> if it is close the density here.
 Loading...