5.9 Adjusting Gradation
179
Maintenance
5
3
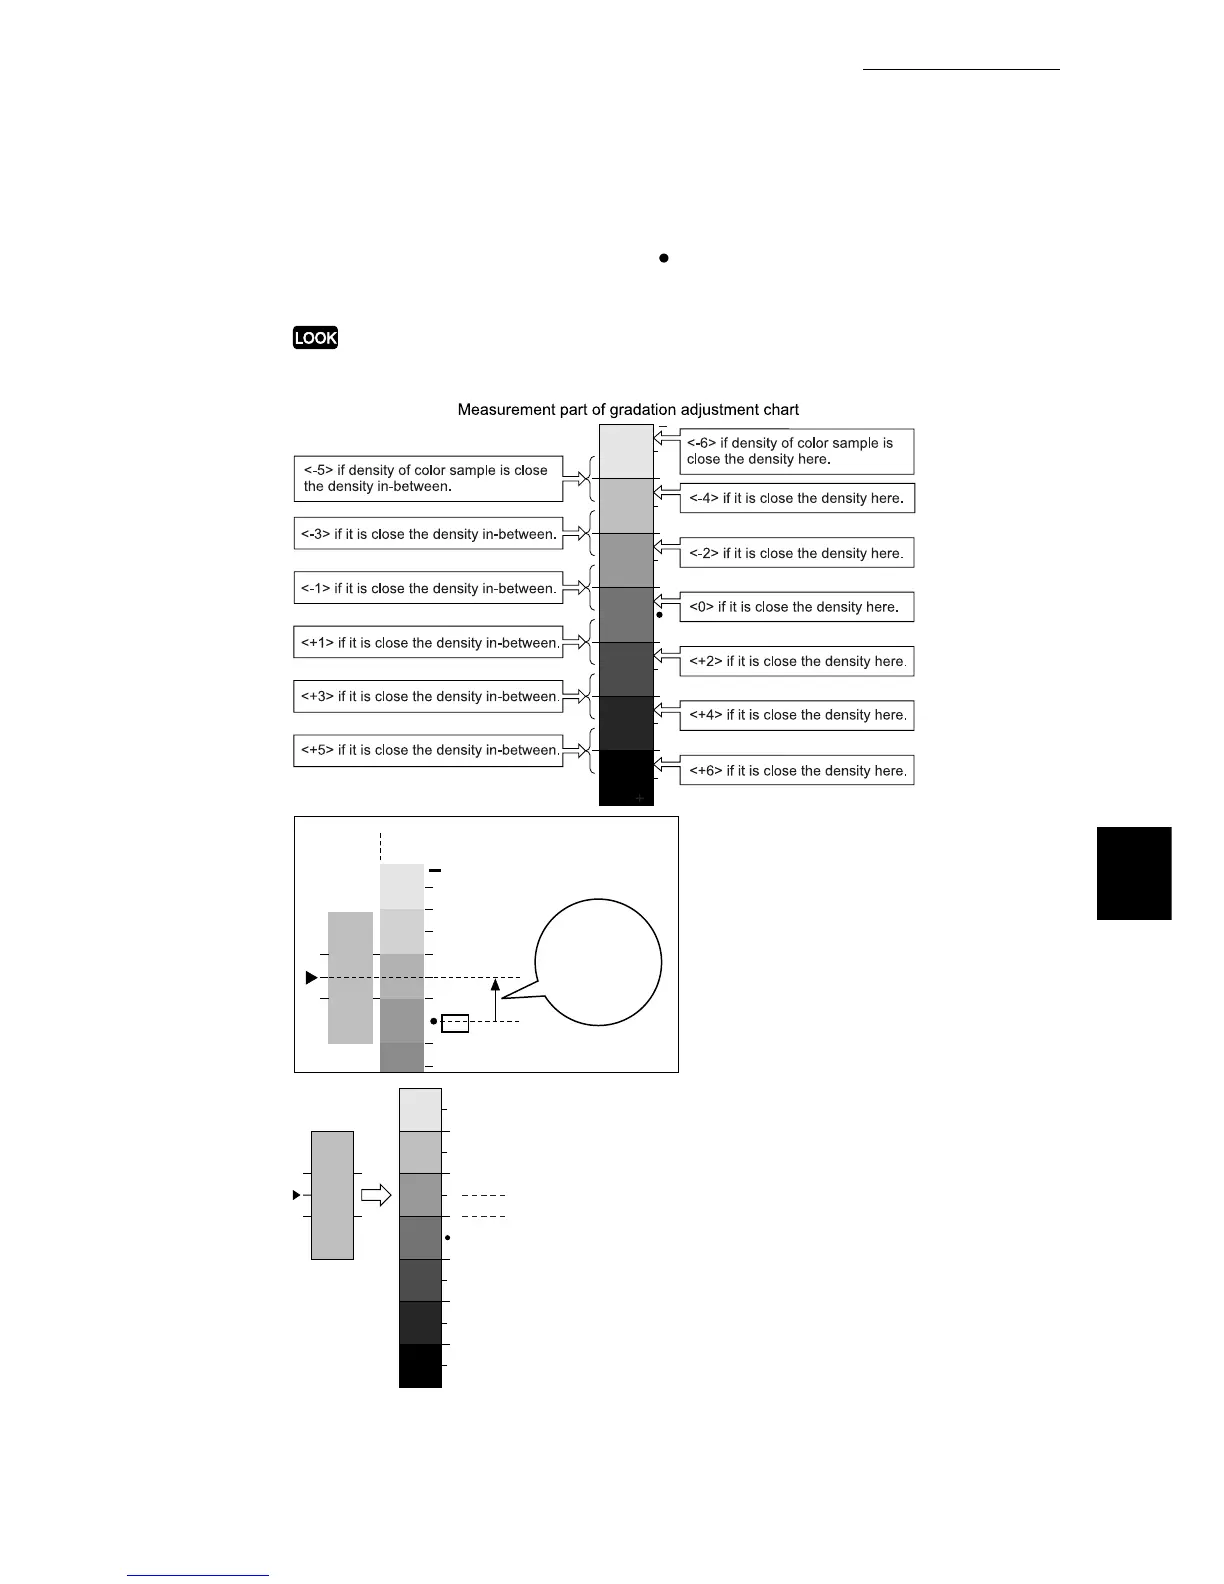
Slide the chart vertically with the “ “ mark using as the starting point
and read difference from the color sample on the scale.
Pay attention to the negative (-) and positive (+) directions.
Cyan
C
Cyan
C
CL
-2
Difference
‑
+
A
"-2"
"-1"
Color sample
for gradation
adjustment
For the example on the left, density of the
gradation adjustment chart close to the color
sample is at the second position in the negative
direction from the central position or density A,
therefore, the difference is <-2>.
 Loading...