135
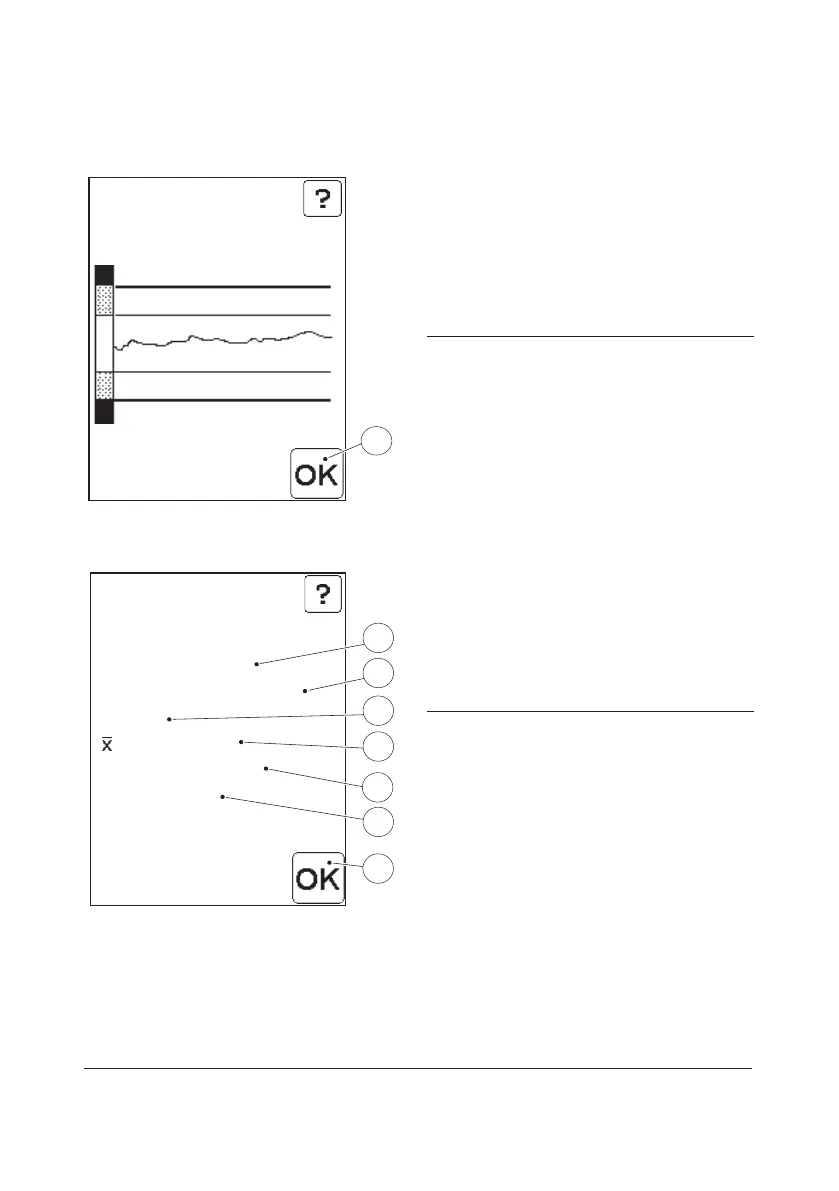
FIGURE 6-12
The diagram shows the trend for the most
recent QC measurements performed on the
control lot.
h) To continue to the statistics image,
FIGURE 6-13, press the Confirm
button(9).
10 Confirm button
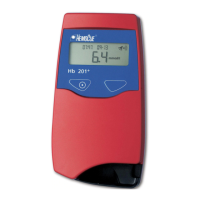
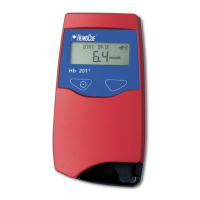
QC Level 1
All Statistics
Lot No: 234567
09/10/03 - 09/11/03
N= 30
= 52 mg/dL
SD= 0.76 mg/dL
CV= 1.5 %
11
12
13
14
15
16
17
FIGURE 6-13
The All Statistics report shows statistical data
for all QC Tests for the level of control and
Lot No. displayed.
i) Press the Confirm button(16). FIGURE
6-10 will be displayed.
11 Lot No. of Liquid Control used in QC tests
12 Date interval of test results
13 No. of test results on which statistics are based
14 Mean value
15 Standard Deviation
16 Coecient of Variation
17 Confirm button
 Loading...