10.4 Effects of Current Density
(Illustration 1)
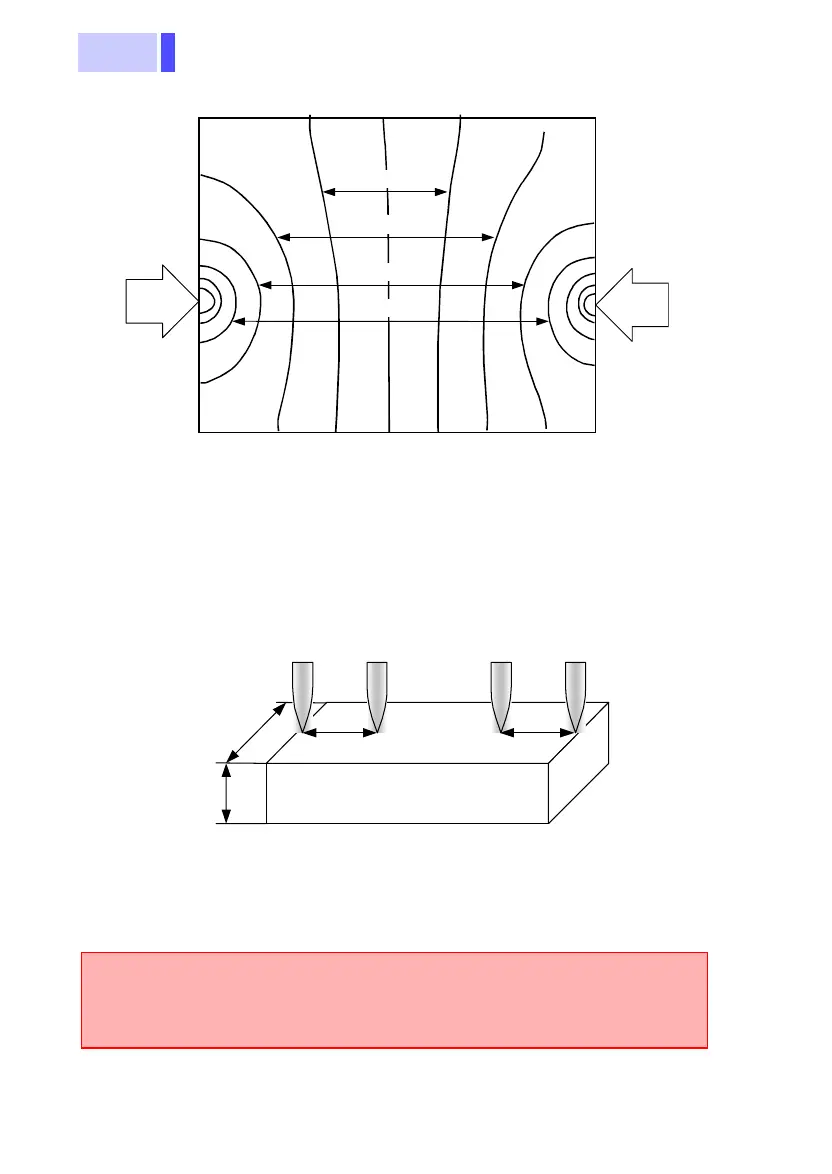
A plot of the equipotential lines of metal plate showing current
distribution at 50 µV intervals when applying a 1 A current at the
endpoints of the plate (W 300 X L 370 X t 0.4)
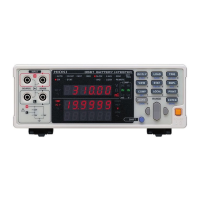
As shown in Illustration 2, it is desirable to locate the sensor ter-
minals within the plate's W or t value of the sense terminals:
(Illustration 2)
Probing locations when the subject of measurement has width
and thickness values
0.1 mΩ
0.2 mΩ
0.3 mΩ
0.4 mΩ
Current
source
Current
source
SOURCE
SOURCE SENSE
SENSE
W, t or W, t or
W
t
Since when judging battery wear it is important to ascertain
changes arising from the passage of time, use the same
measurement lead for each measurement.