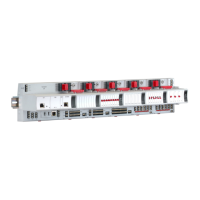
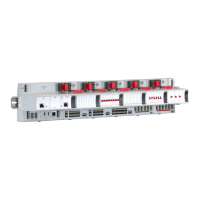
ALPHABETIC REFERENCE EXCEL CARE CONTROL ICONS
74-5577–33 (US) 218
EN2B-0184 GE51 R0518 (Europe)
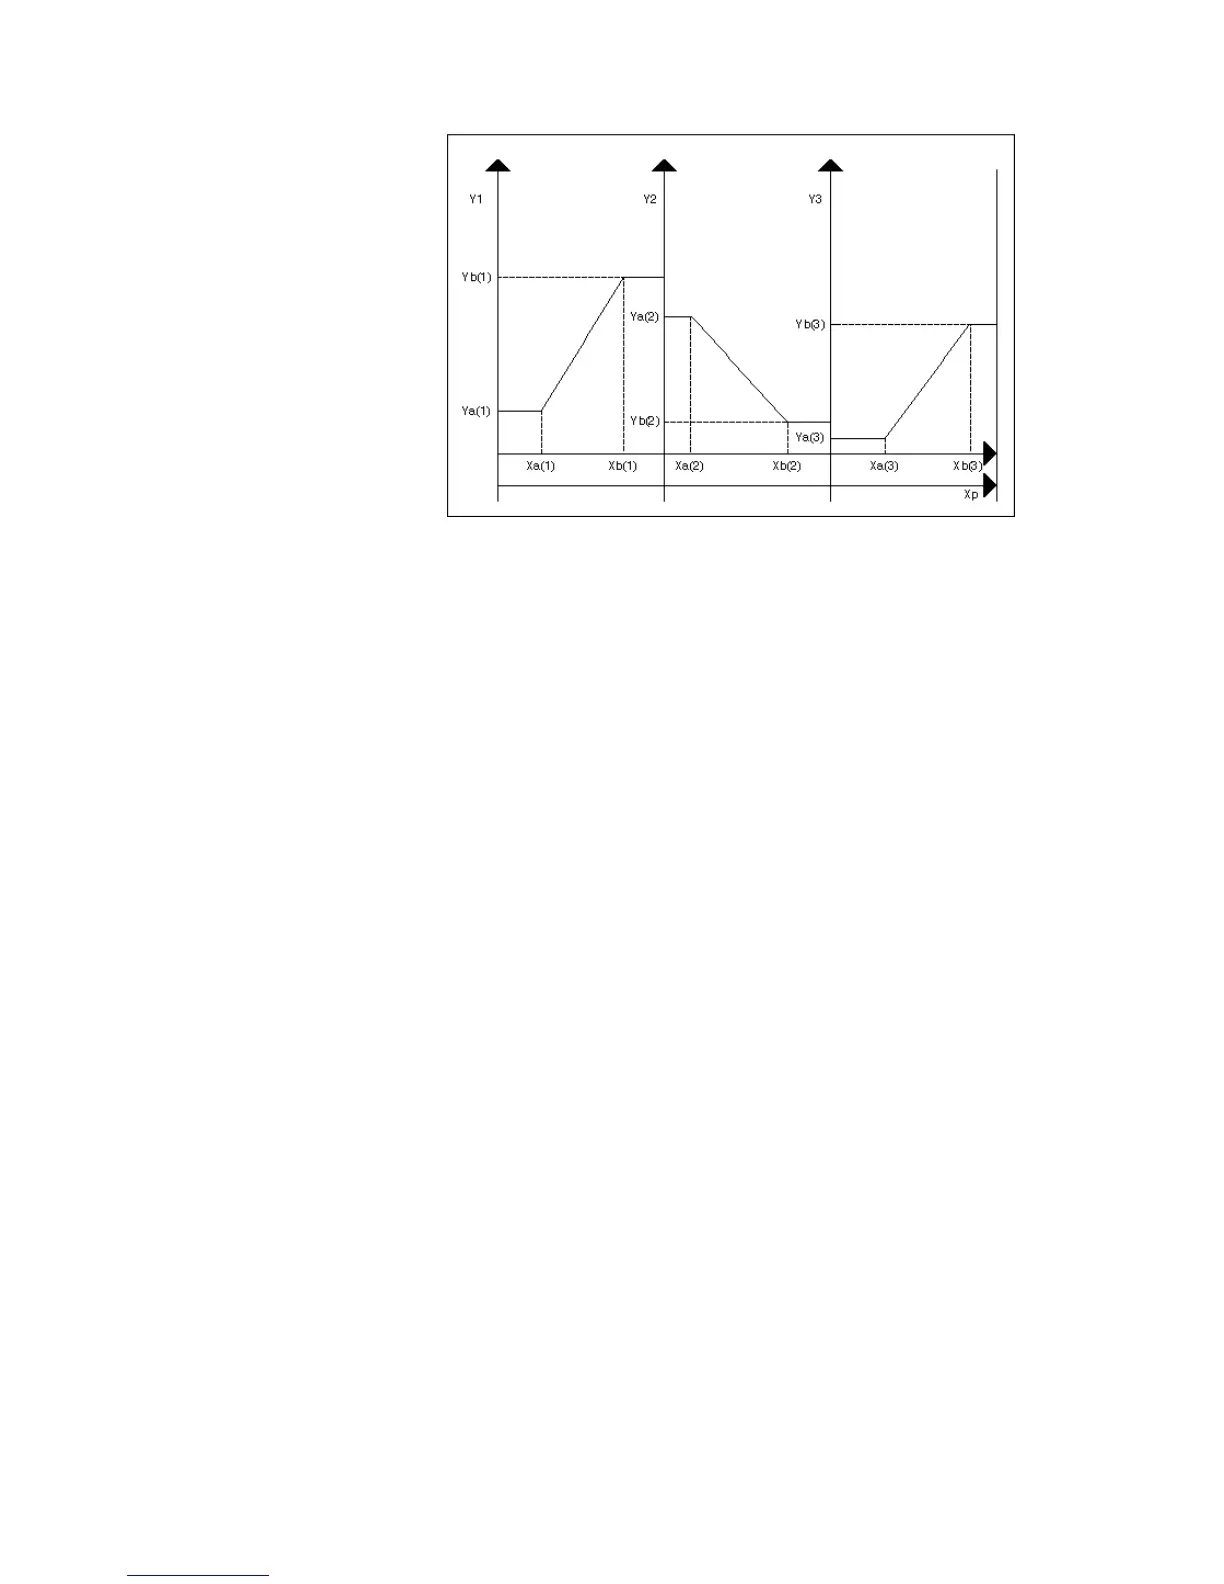
The following diagram shows how software interprets the graph.
Parameter Number
Descriptions P3 Ya(1), the minimum of the Y1 output
P4 Yb(2), the maximum of the Y1 output
P5 Slope of the Y1 output. Formula:
P6 Y1 intersection with the Y axis
P7 Ya(2), the minimum of the Y2 output
P8 Yb(2), the maximum of the Y2 output
P9 Slope of the Y2 output. Formula:
P10 Y2 intersection with the Y axis
P11 Ya(3), the minimum of the Y3 output
P12 Yb(3), the maximum of the Y3 output
P13 Slope of the Y3 output. Formula:
P14 Y3 intersection with the Y axis
The following diagram shows the parameters for the SEQ control icon:

 Loading...