94 Implementing the IBM Storwize V5000 Gen2 with IBM Spectrum Virtualize V8.1
The procedures for how to work with the events log, and how to run various fix procedures by
using the Events option, are described in Chapter 12, “RAS, monitoring, and troubleshooting”
on page 661.
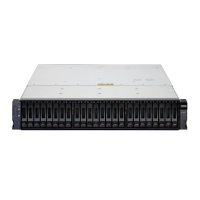
3.3.4 Performance
The Performance pane reports the general system statistics that relate to processor (CPU)
use, host and internal interfaces, volumes, and MDisks. You can switch between MBps or
IOPS, or even navigate to the statistics at the node level. The Performance pane might be
useful when you compare the performance of each node in the system if problems exist after
a node fail over occurs. See Figure 3-30.
Figure 3-30 Performance statistics of the IBM Storwize V5000 system
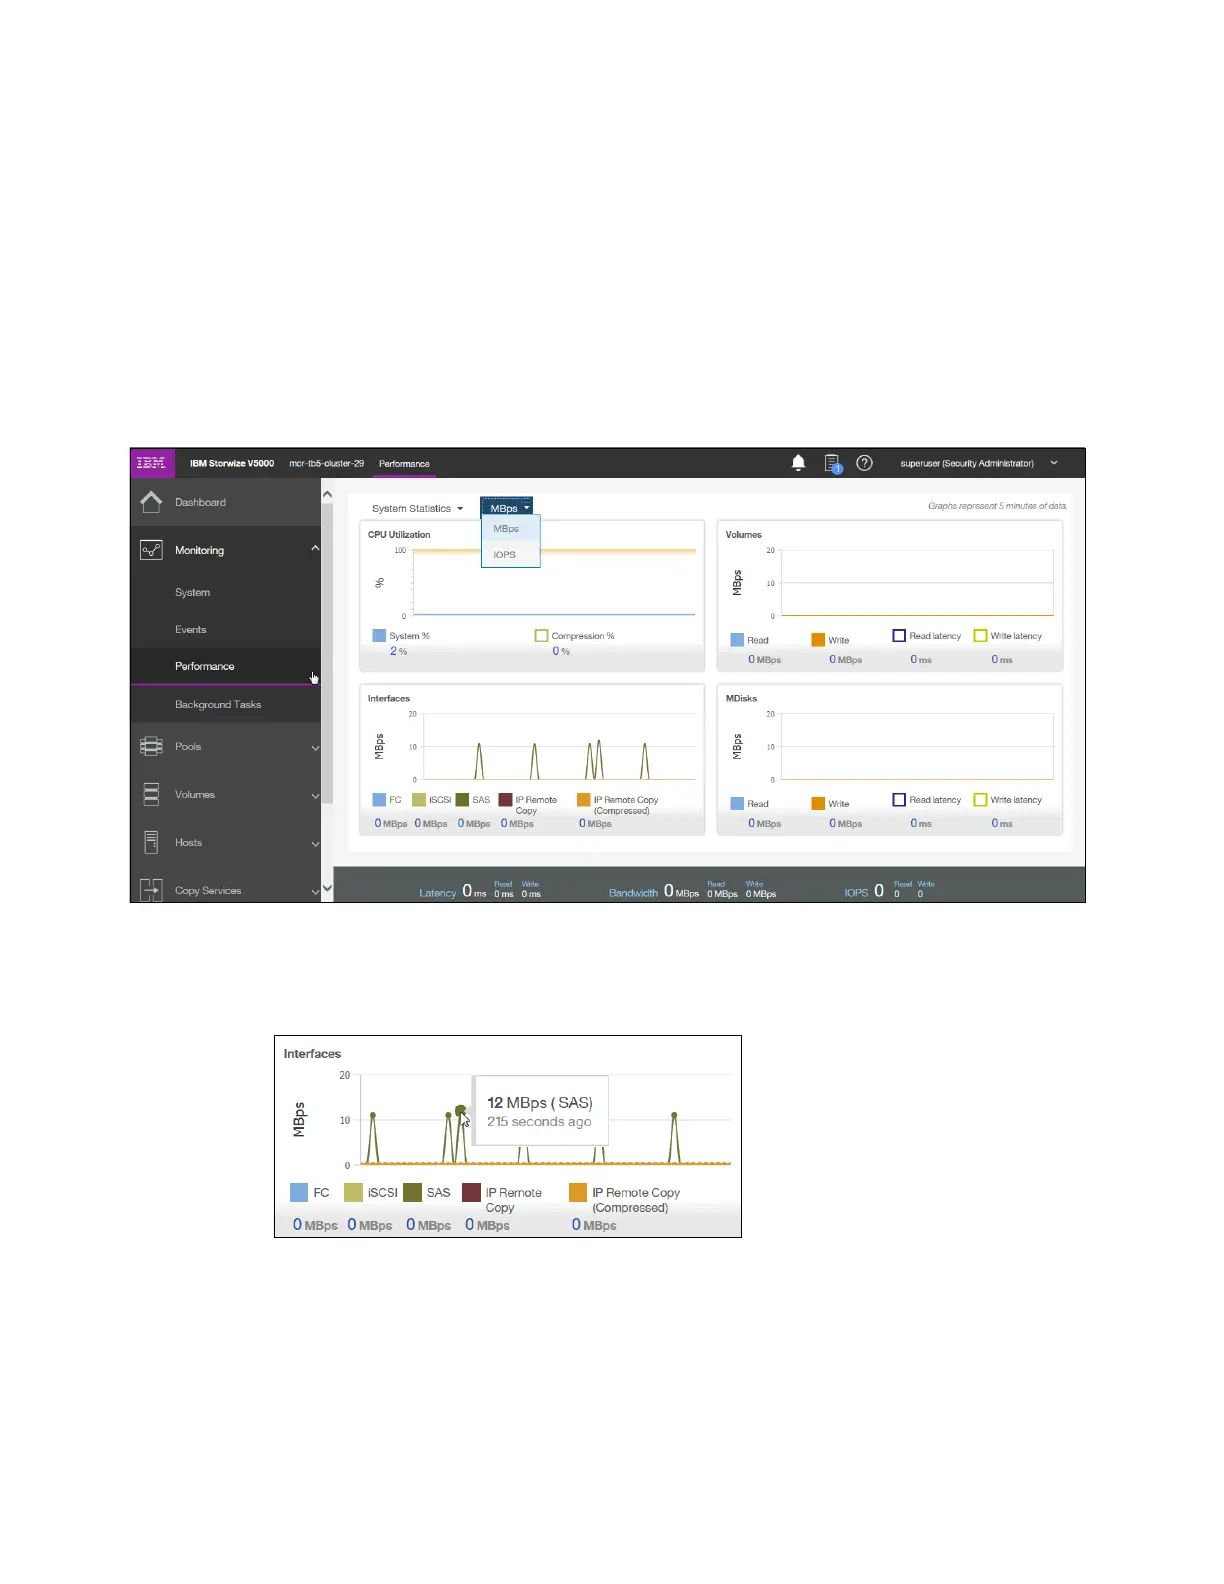
The performance statistics in the GUI shows, by default, the last 5 minutes of data. To see the
details of each sample, click the graph and select the time stamp, as shown in Figure 3-31.
Figure 3-31 Sample details
As mentioned before, the previous charts represent 5 minutes of the data stream. For
in-depth storage monitoring and performance statistics of your IBM Spectrum Virtualize with
historical data, use the IBM SmartCloud® Virtual Storage Center. You can also obtain a
no-charge unsupported version of the Quick performance overview (qperf) for the IBM SAN
Volume Controller (SVC) and Storwize systems from this website:
http://ibm.biz/Bd499x
 Loading...