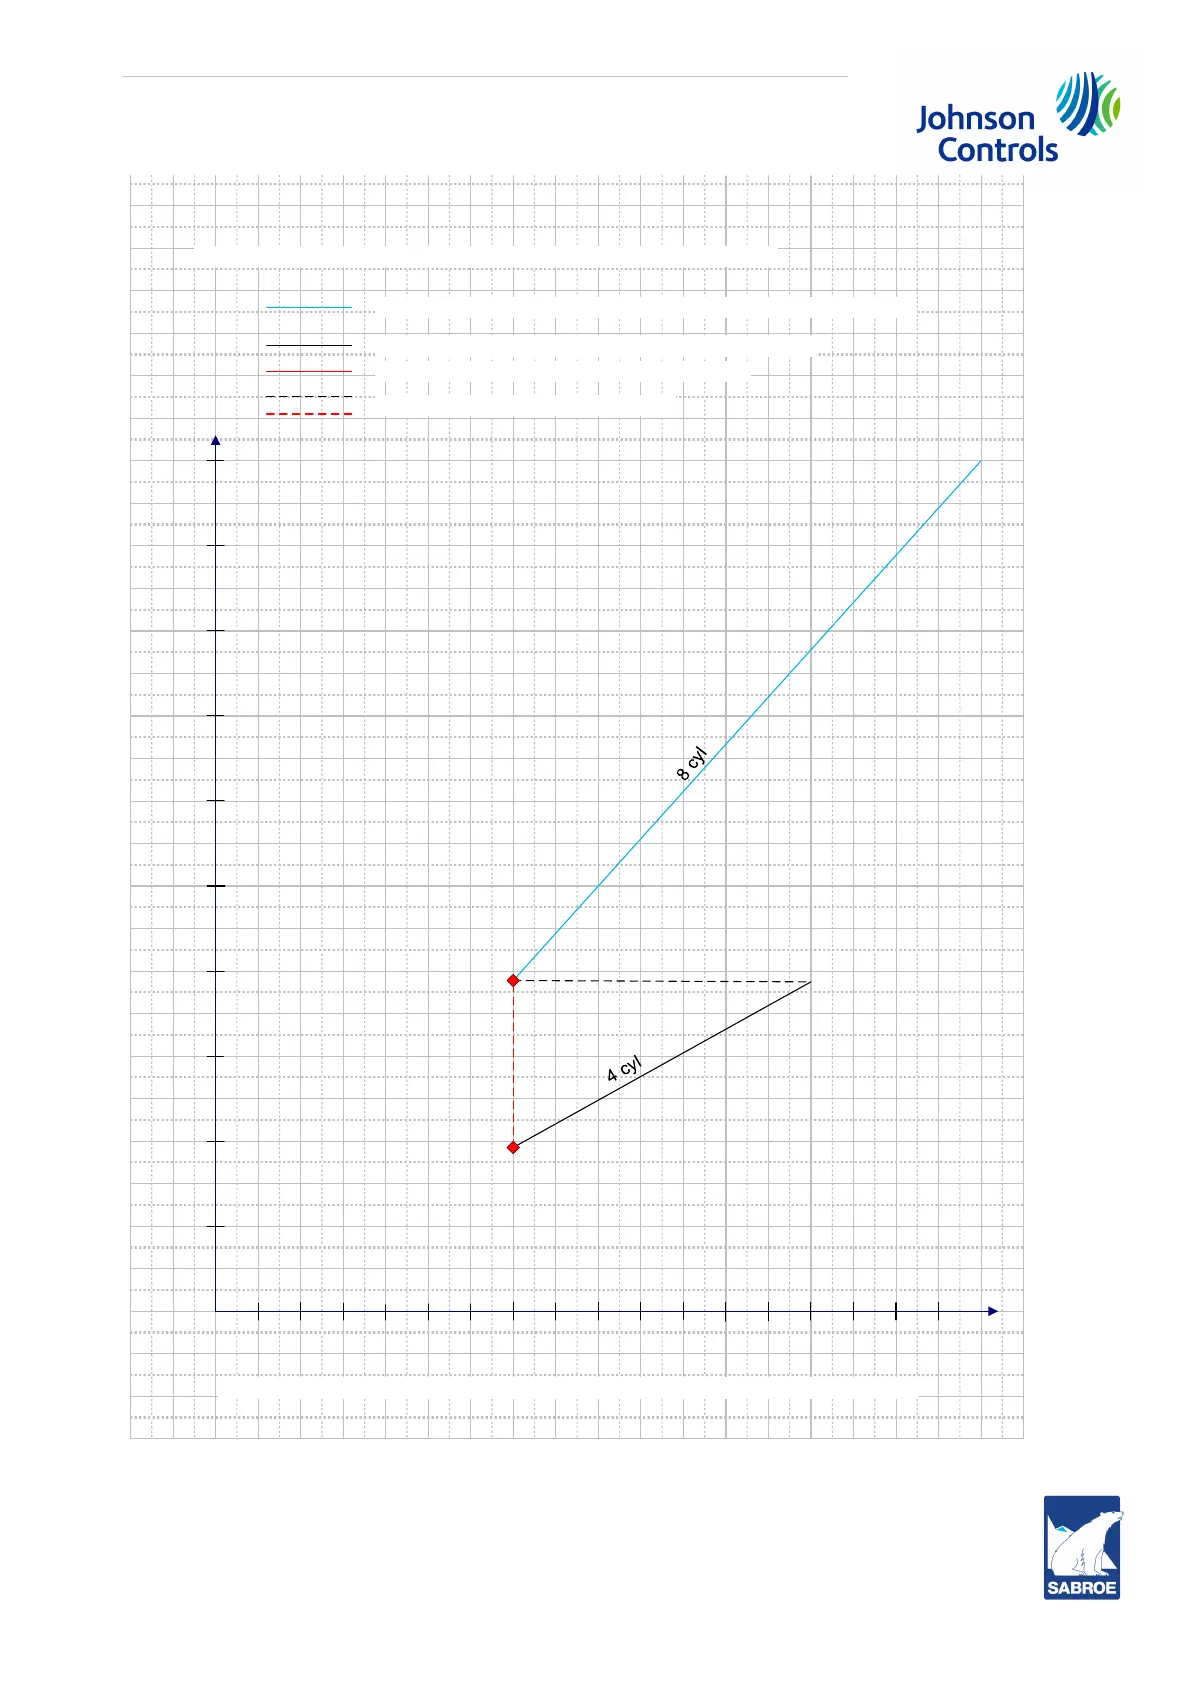
Fig. 22: Capacity vs speed diagram, CMO/HPO 28-38 with Centa coupling.
Capacity vs speed diagram, C MO/ H P O 28 & 38 V S D with C e nt a co u plin g
Speed (rpm)
Capacity %
005100010050
0
1 0
2 0
3 0
4 0
5 0
6 0
7 0
8 0
9 0
10 0
Black line: SPEED mode (optimised for best regulatio n )
Red line: S T EP mode (optimised for best COP)
4 cyl
8 cyl
Blue, red and black lines: operation with appro p riate motor selection
Dashed lines: transient operation only
Note: Actual allowed speedrange depends on operating conditions and motor selection.
 Loading...