BA053101-en
3 Press the left hand mouse key.
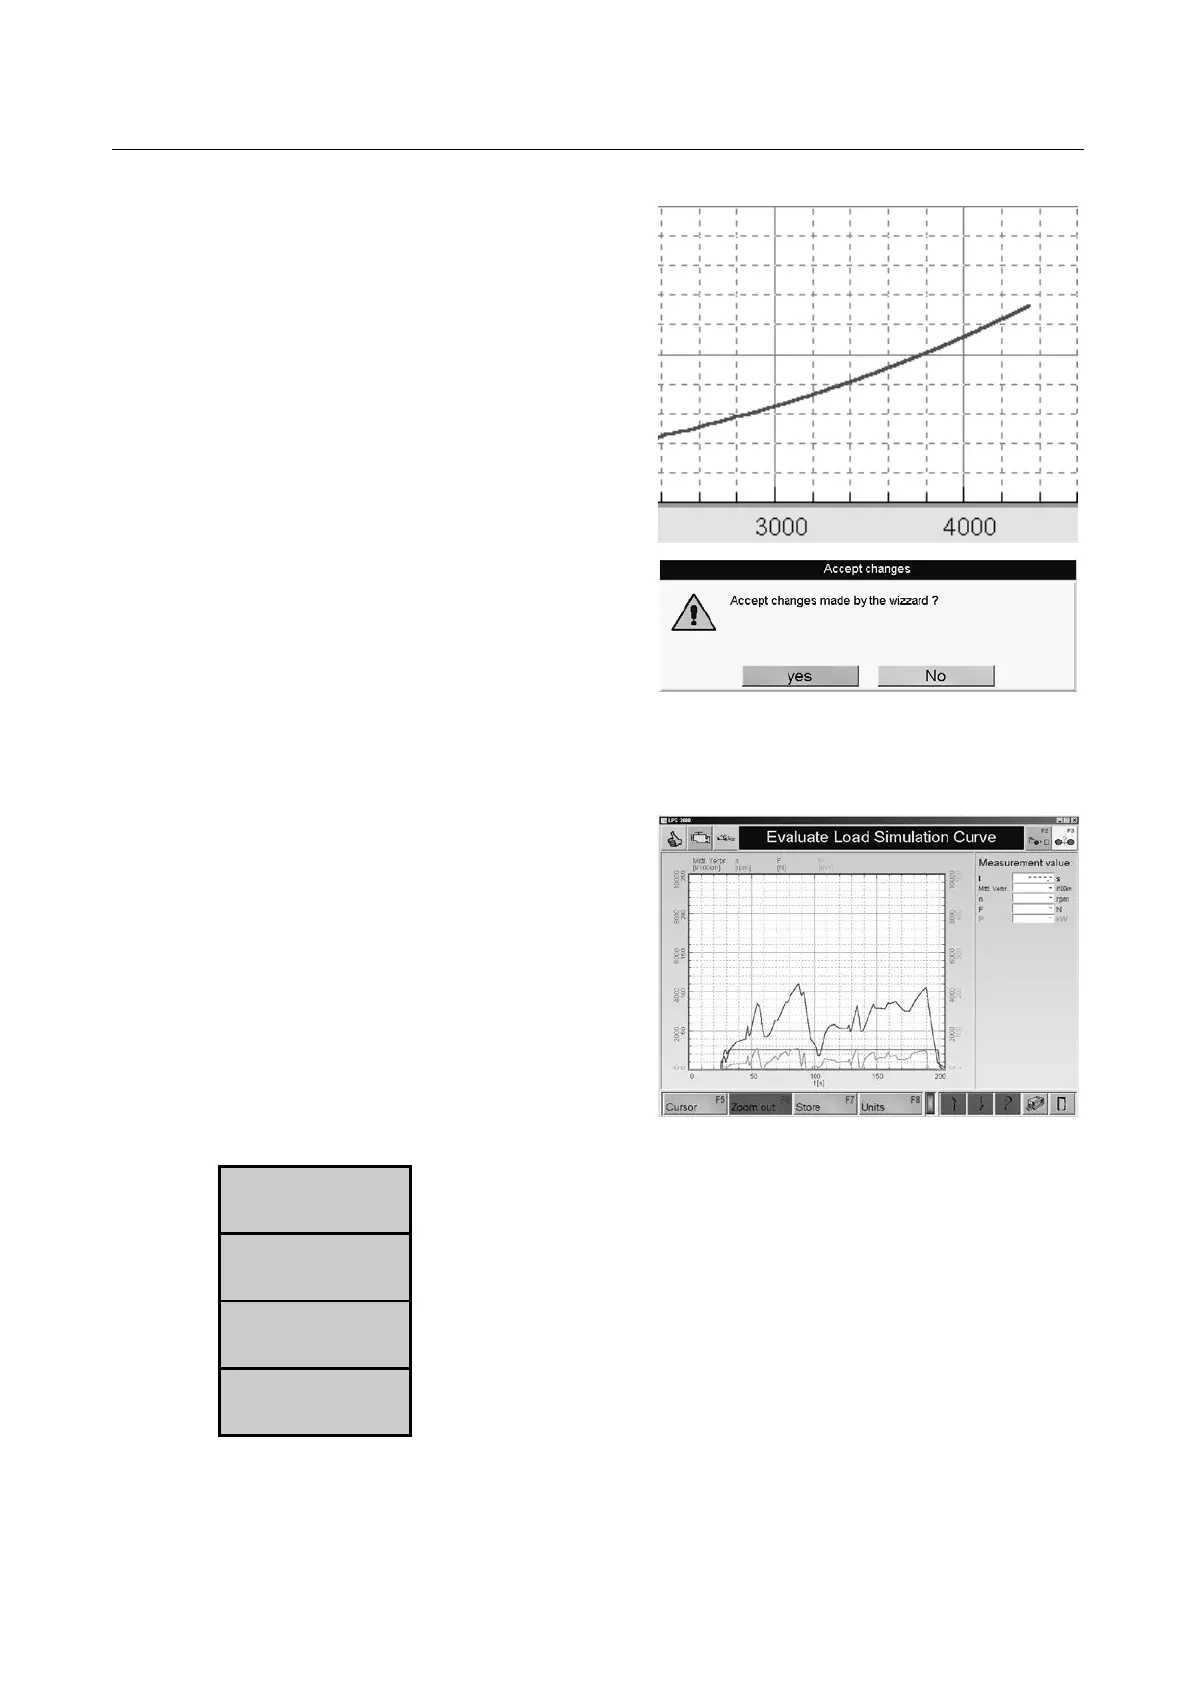
The curve is smoothed by interpolating.The
interpolation is only done on the upper half of
the curve.
4 Use the button <F7 END WIZARD >.
The following window appears:
5 Select YES to store the changes, if not,
select NO.
Pos: 331 /Tech nische D okumen tation/A lle G eräte/ Überschr iften/Üb ers chrifte n 1.1.1/Z /Über schrift 1.1.1: Z eit-D iagra mme @ 13\m od_1234860267127_75.docx @ 340687 @ 3 @ 1
Pos: 332 /Tech nische D okumen tation/ Leistu ngsmess techni k/POWE RDYNO /052301 LPS 3000 R100/BA/Inhalt: 0523 Zeit-Diagramm e @ 13\mod_1234860311008_75.docx @ 340713 @ @ 1
1
Call up the menu DATABASE and then menu
point TIME DIAGRAM
⇒ The database Browser appears:
2 Select a dataset with the cursor key or the
mouse.
3 Open the dataset by double clicking or press
the <ENTER> key.
⇒ The measurement screen appears.
• Use this button to blend the cursor in and out.
The cursor can be moved using the mouse key.
• Use this button to display the original picture again, step by step,
(see paragraph
"Zoom-Function"
in Chapter
"Measurements"
).
• Use this button to store the vehicle and customer data (see Chapter 6,
Paragraph "
Identical Functions
" and function "
Store"
).
• Use this button to change the units.
(see paragraph
"Units"
in Chapter
"Settings"
).
Pos: 333 /-----F ormat- ----/MA NUELLE R UMBR UCH Seitenum bruch @ 0\mod_1134403577687_0.docx @ 1277 @ @ 1
 Loading...