BA053101-en
Pos: 263 /Te chnis che D okum ent ati on/ Leis tun gsm esst ech nik/ POWE R DYN O/0 523 01 LPS 3 000 R10 0/B A/I nhal t: 052 3 Aus wert en @ 2 3\mod_1297674749035_75.docx @ 975575 @ @ 1
Evaluation / Data Logging
1 Use the button <F8 EVALUATION>.
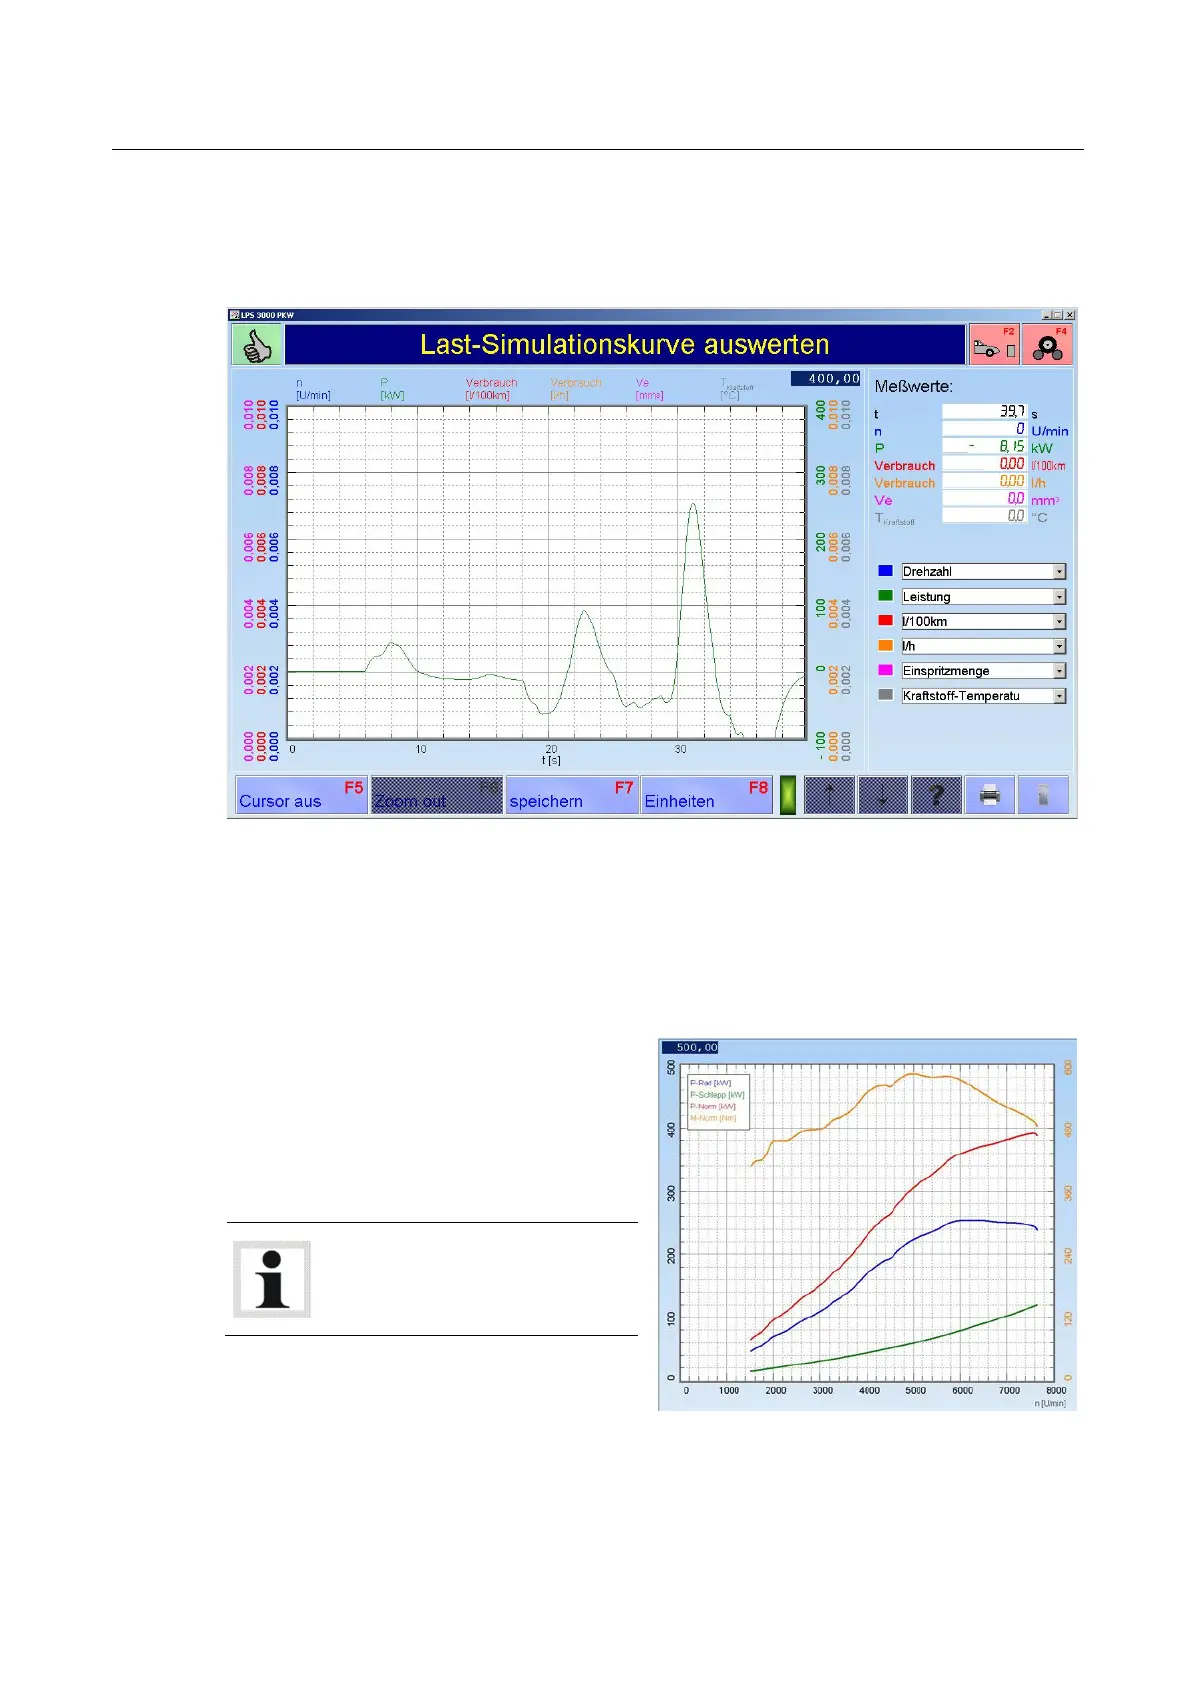
The following screen appears:
2 Use the drop-down menus on the right-hand side to select and save up to six test values per
diagram. The number of diagrams which can be saved is not limited.
3 Exit the measurement screen with <ESC>.
Pos: 264 /Te chnis che D okum ent ati on/ Leis tun gsm esst ech nik/ POWE R DYN O/0 523 01 LPS 3 000 R10 0/B A/I nhal t: 052 3 Ska lier ung der Graf iken @ 23\mod_1297677904746_75.docx @ 975788 @ @ 1
Scaling the Power and Load Simulation Graphs
The Power and Load Simulation graphs can be manually scaled as follows:
1 Double-click the upper left- or right-hand
corner of the diagram.
An entry field opens.
2 Enter the desired scaling value.
3 Confirm with RETURN or ENTER.
The Power values [kW] are scaled
using the left-hand x-axis, the
additional test values using the
right-hand x-axis.
Pos: 265 /-----F ormat- ----/MA NUELLE R UMBR UCH Seitenum bruch @ 0\mod_1134403577687_0.docx @ 1277 @ @ 1
 Loading...