Version 1.10 Page 102 of 203
4.3.3 HISTORY
The History section allows you to analyze an athlete’s progress by graphically and numerically
analyzing a series of tests. The section can also be used to analyze the team members, comparing
them using the same test type.
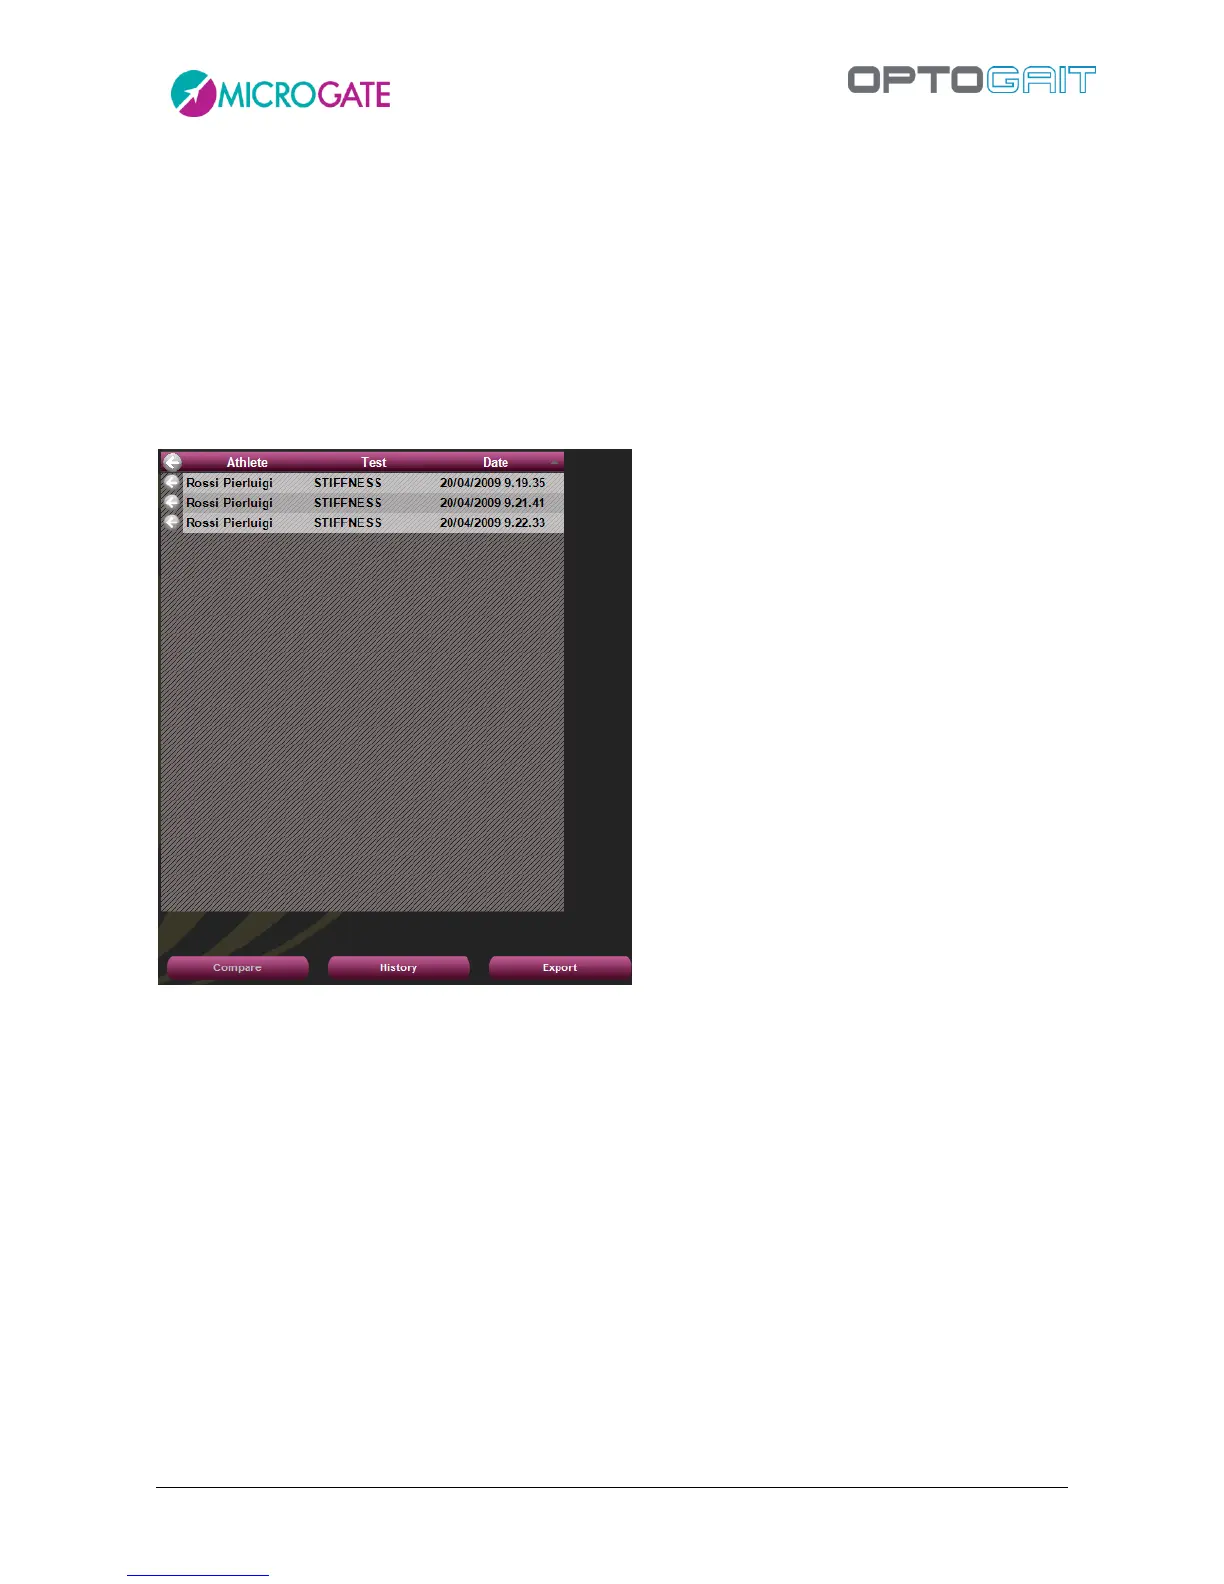
Select two or more tests (generally of the same type or uniform in order to ensure plausible data)
and press <History>. It is possible to first decide first the sequence with which to view the progress
(usually chronological), clicking on one of the column headers (e.g. Date) and then clicking on the
<History> button.
Figure 86 –History analysis of three tests ordered by date
Pressing <Configure> allows you to choose which value to consider for progress analysis: it is
possible to select one of the number of jumps or the average, best, worst or standard deviation
value.
If the tests had a defined starting foot, it is possible to view the data and progress graphs for only
one foot or the difference of both feet.
Clicking on the column headers, data are ordered by measure and the graph is updated. This is very
useful, for example, to order the team members from the worst to the best value of any parameter
(e.g. from the slowest to the fastest in a 12 m sprint test).
It is possible to use the History module also on a single test (usually a run/gait test where the starting
foot has been set), where it is possible to spot asymmetries between the right and left foot using
the option 'Diff%'.