Version 1.10 Page 146 of 203
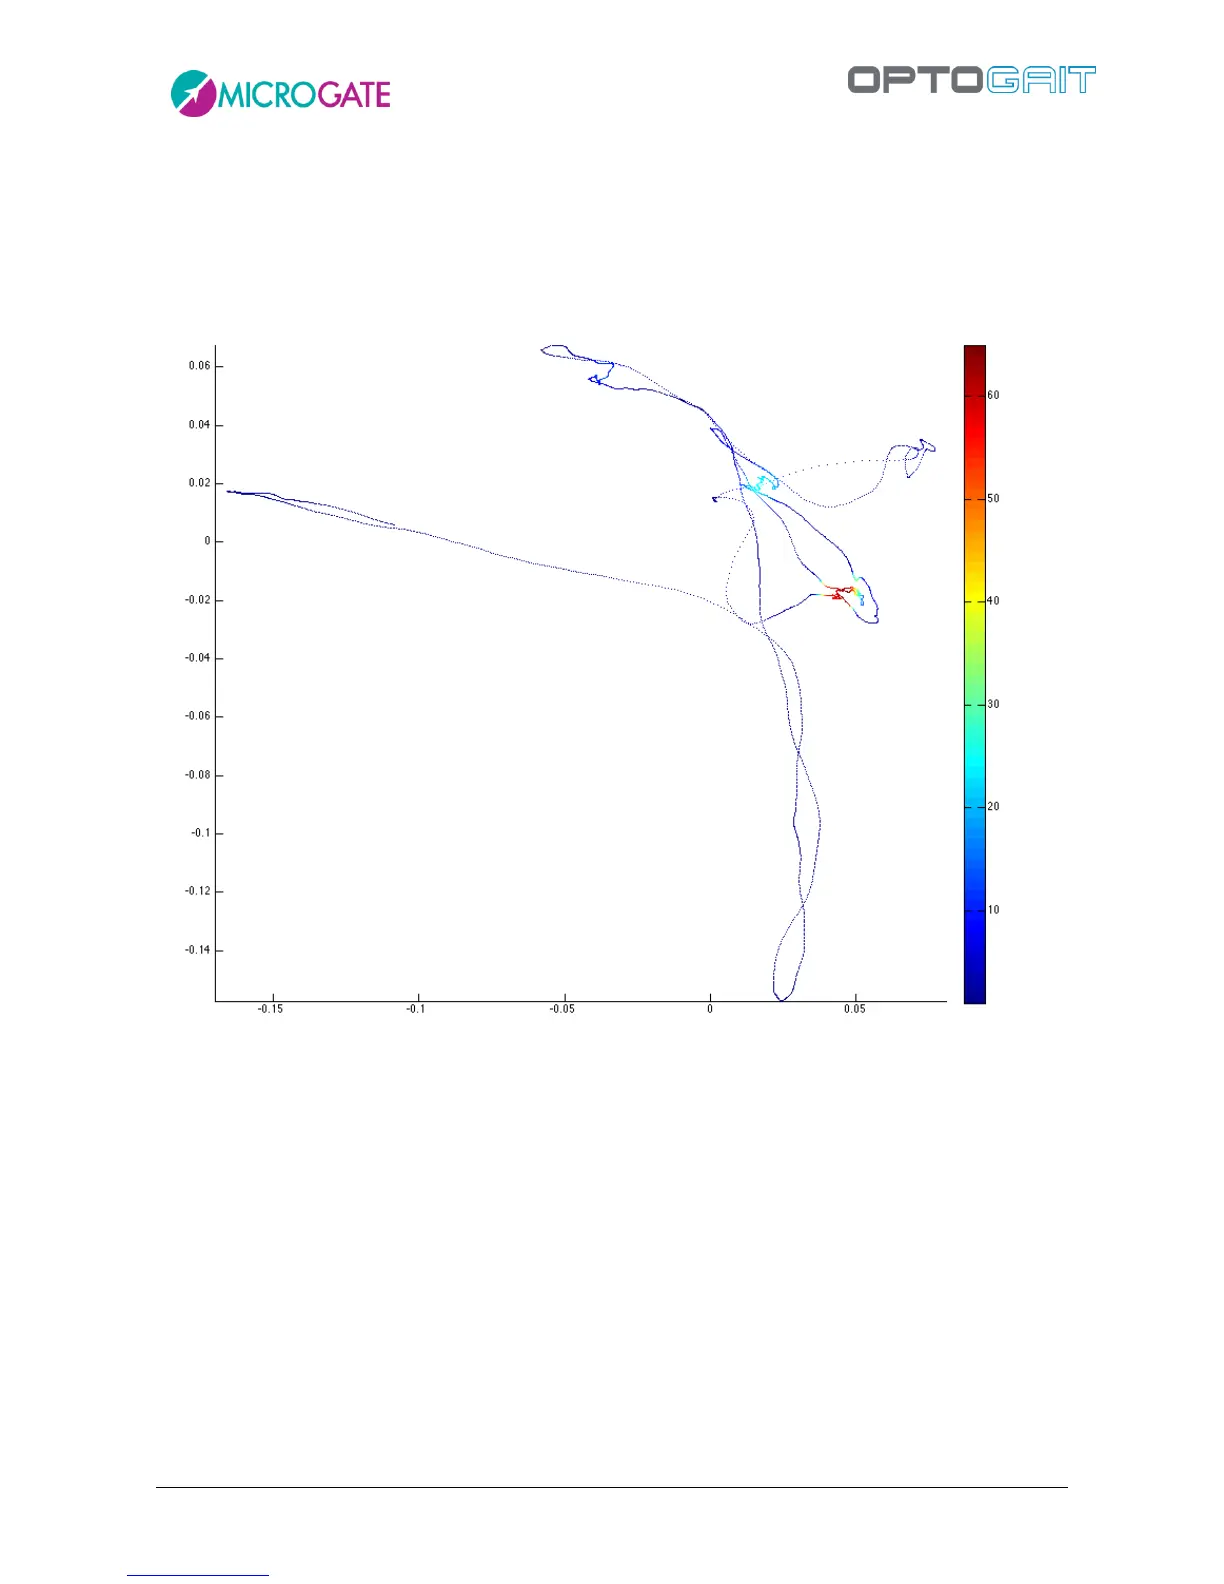
Let's take as an example a trajectory of a Posture (Sway) test. The graph is slightly different to the
one used in the software but it gives us a better understanding of the data (the colour scale that
describes the density of points by area – blue = low density, red = high density – is not present in
the software).
On the x there is the medio-lateral trajectory (left/right) and on the y the antero-posterior trajectory
(forwards/backwards).
[ref. Prieto et al, Measure of Postural Steadiness, Transaction on Biomedical Engineer, 1996]