MSB780(X) - User’s Guide
7.2 Graph screen
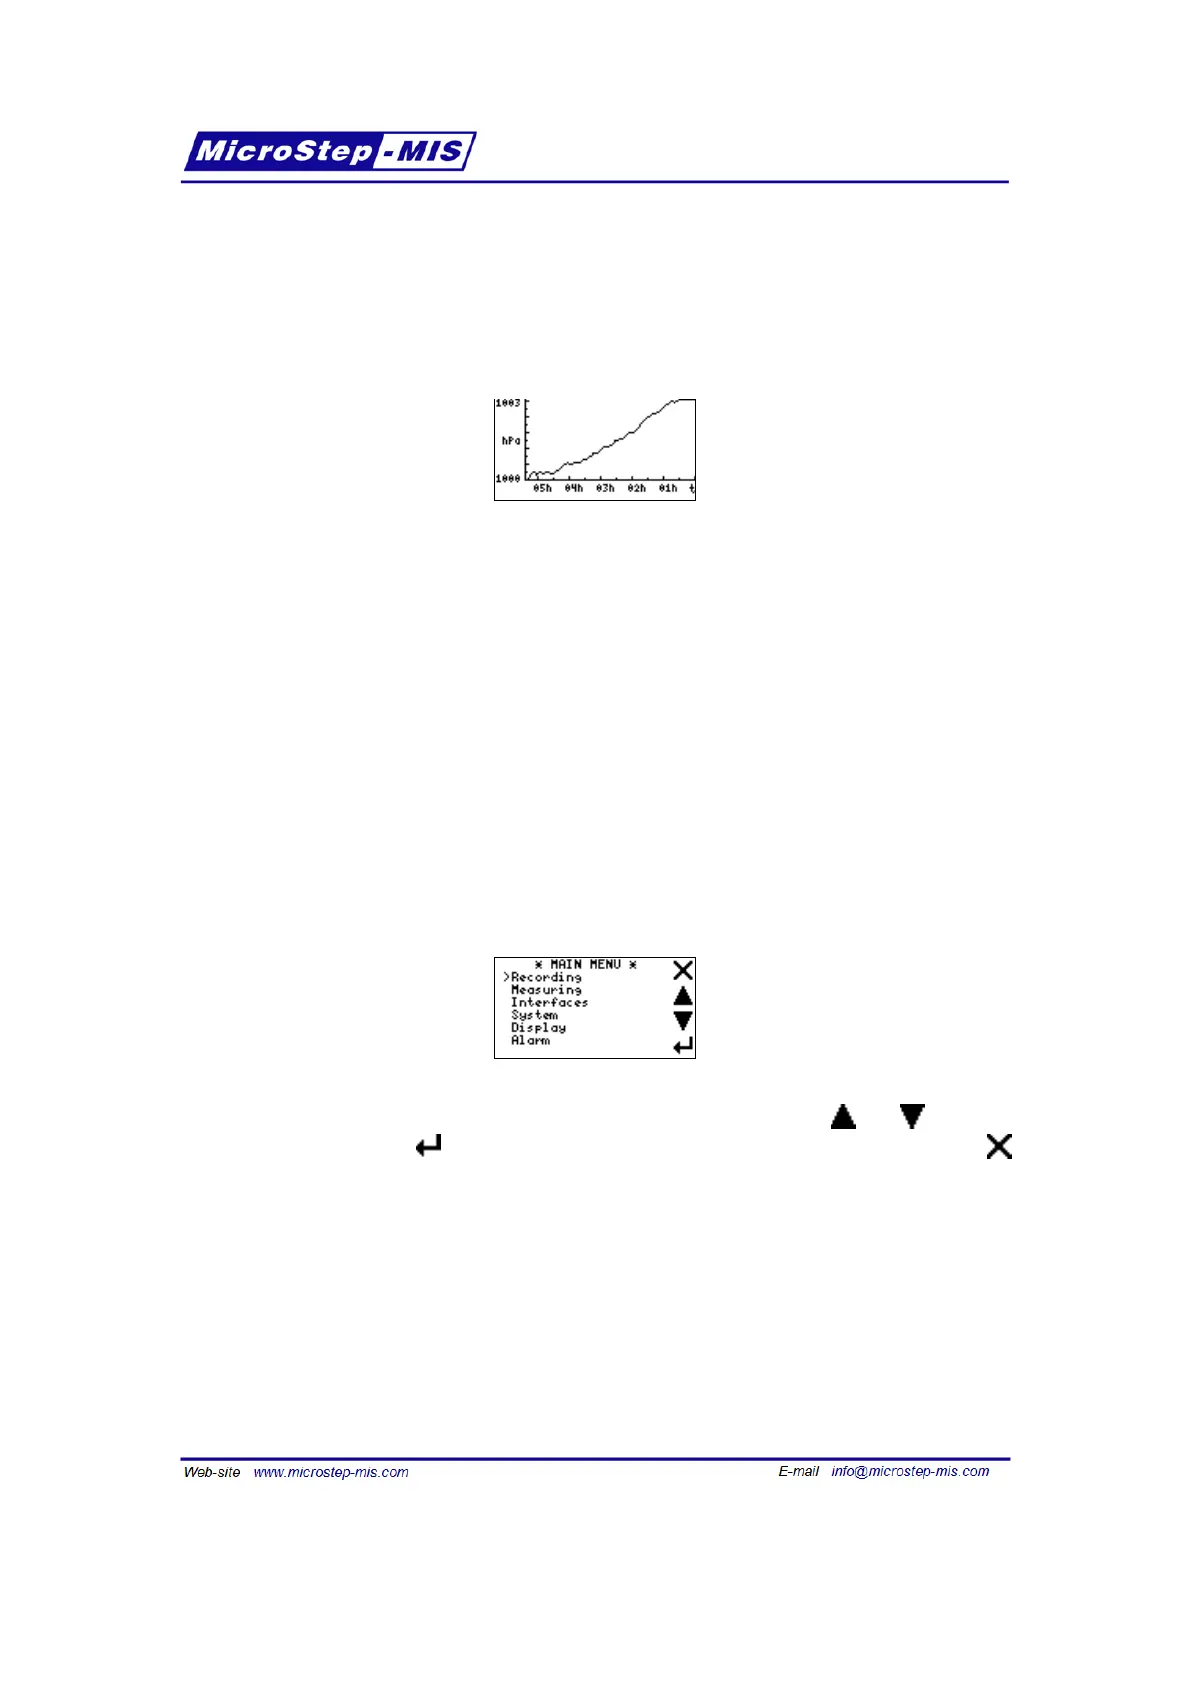
Graph view is activated by tapping the Graph button on the main screen. Example of the Graph
screen is in the following picture:
The graph always shows time on horizontal axis and measured pressure on the vertical axis
(with no regard on what is shown on basic screens).
The vertical axis is auto-scaled with minimum axis span 1 hPa.
The scale of horizontal axis can be chosen in Display menu, as described in section 7.9 on page
70.
Tap anywhere on the screen area switches back to the last shown basic screen.
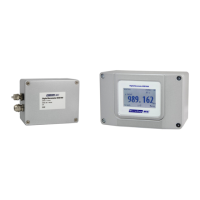
7.3 Main menu
By tapping the Menu button on a basic screen you can enter the Menu:
Four buttons on the right are used to navigate through the menu. Buttons and move the
cursor up or down. Button is used for entering submenus or for saving changes. Button
is used to exit submenus.
7.4 Menu structure
• Main menu
– Recording
∗ Recording
∗ List
60